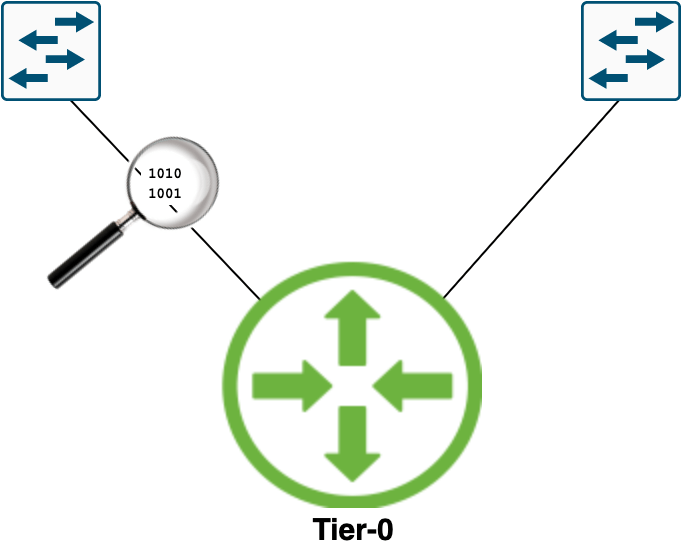
With NSX-T logical networking the Tier-0 uplinks become the central passage for all of the North-South traffic—i.e., traffic between the NSX-T logical networks and the physical network.
A critical point in the NSX-T data plane and one that we might want to place under a magnifying glass from time to time.
In this short article I’ll walk through setting up and managing packet captures on Tier-0 uplinks.
1 – Identify active SR location
This step is relevant when the Tier-0 gateway is running in Active-Passive HA mode. Most of the time the interesting packets will be on the active uplinks and we need to figure out where these are situated.
With Active-Active HA mode all of the Tier-0 uplinks are involved in forwarding traffic and therefore points of interest when it comes to capturing packets
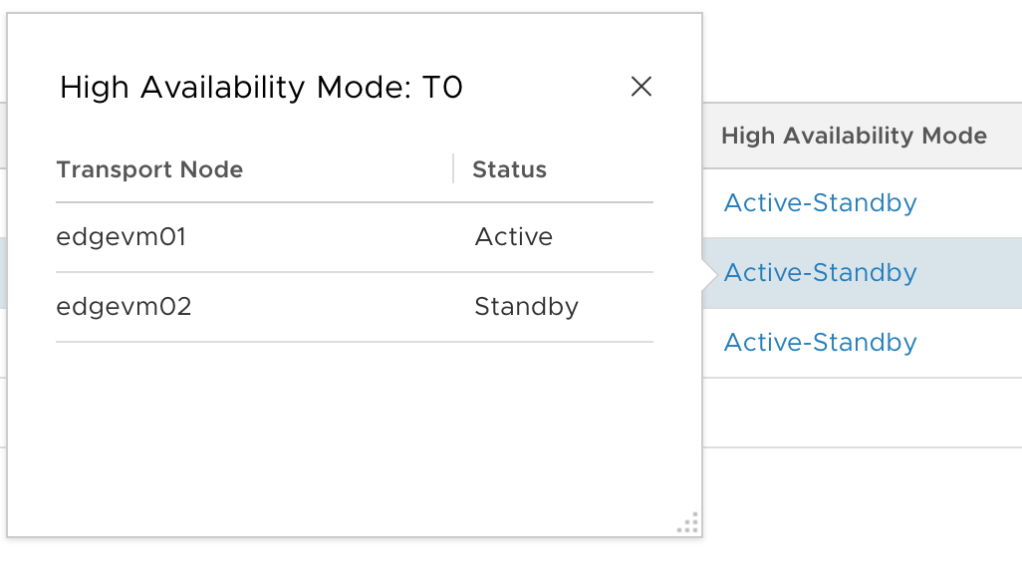
In the NSX Manager UI, navigate to Advanced Networking & Security > Networking > Routers. Click the Active-Standby link for the Tier-0 gateway:
Here the active Tier-0 SR is located on edgevm01.
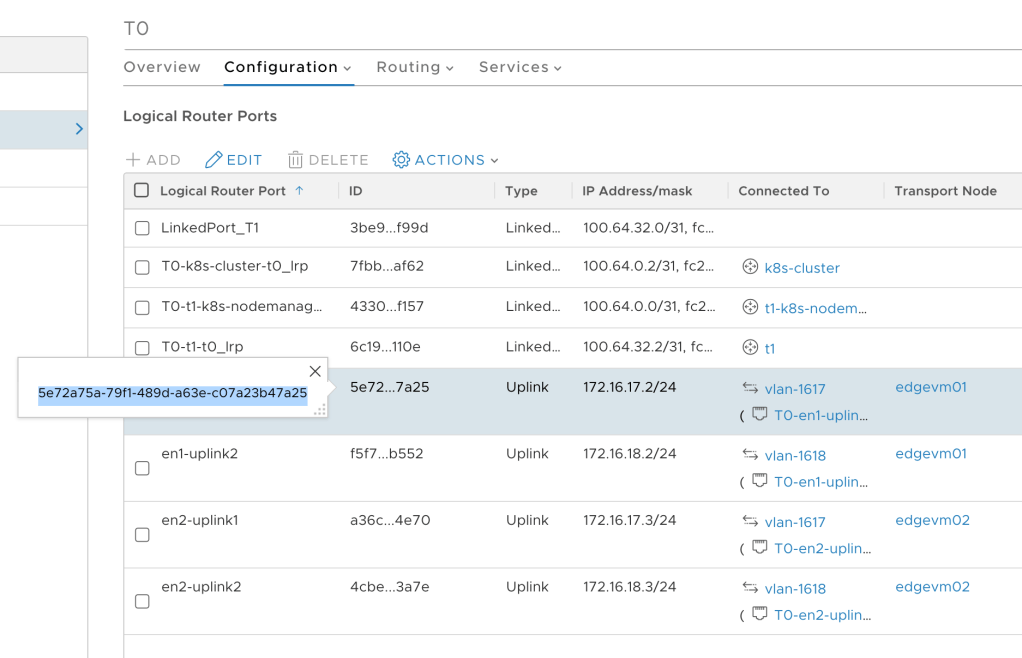
2 – Identify interface ID
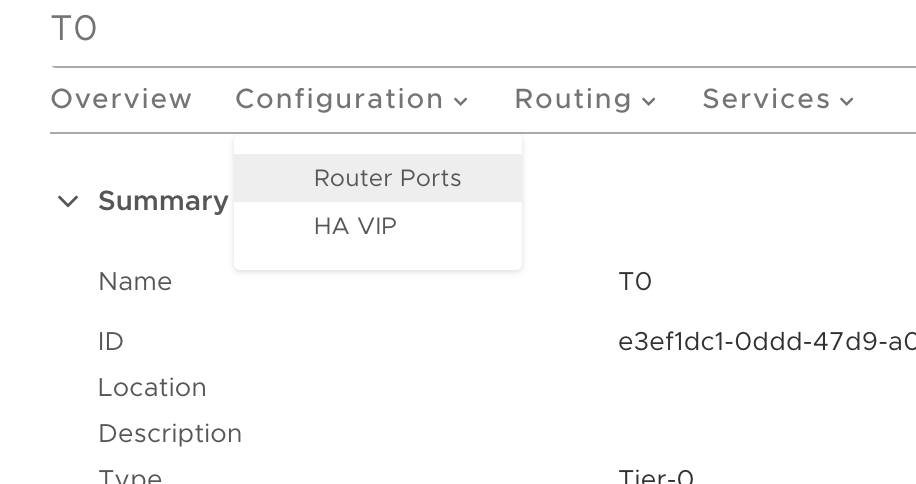
Also under Advanced Networking & Security > Networking > Routers we click the name link of the Tier-0 gateway. This opens up the details pane where we choose Configuration > Router Ports:
Copy the ID of the uplink interfaces that use the Edge node with the active Tier-0 SR:
3 – Start capture session
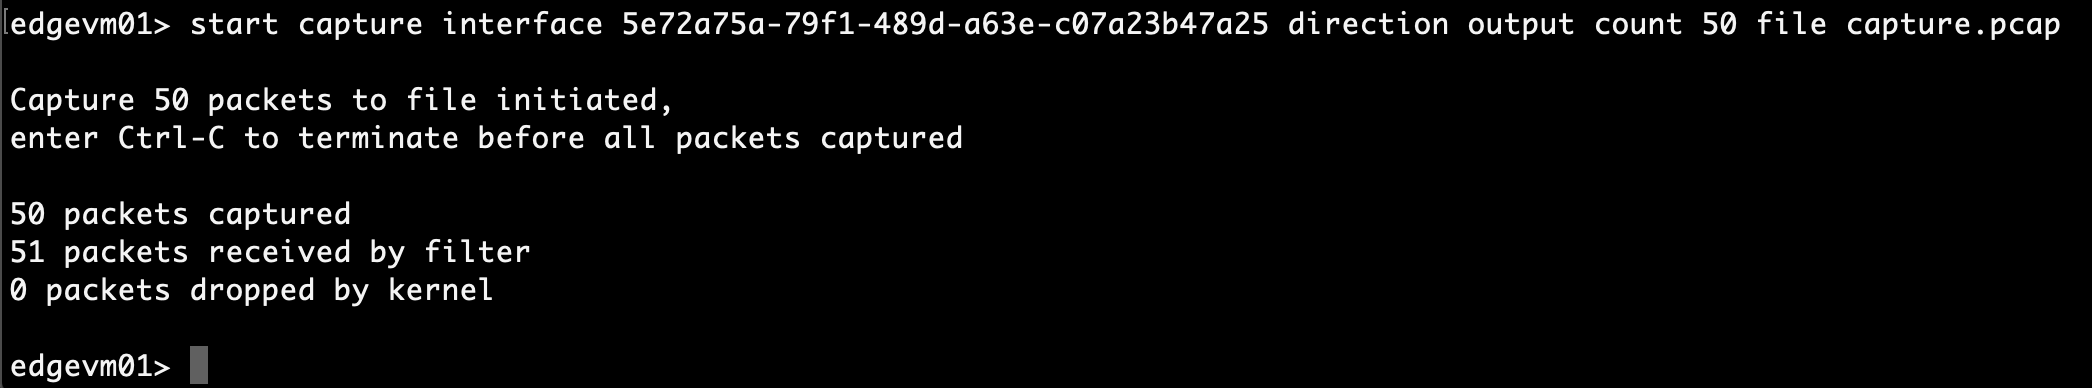
SSH into the Edge node with the active Tier-0 SR. To capture 50 outgoing/northbound packets run the following command:
start capture interface <ID> direction output count 50 file capture.pcap
For example:
4 – Copy capture file
The resulting capture.pcap file can now be copied to an SFTP server. For example:
After a successful copy you might want to delete the capture.pcap file from the Edge node’s file store:
del file capture.pcap
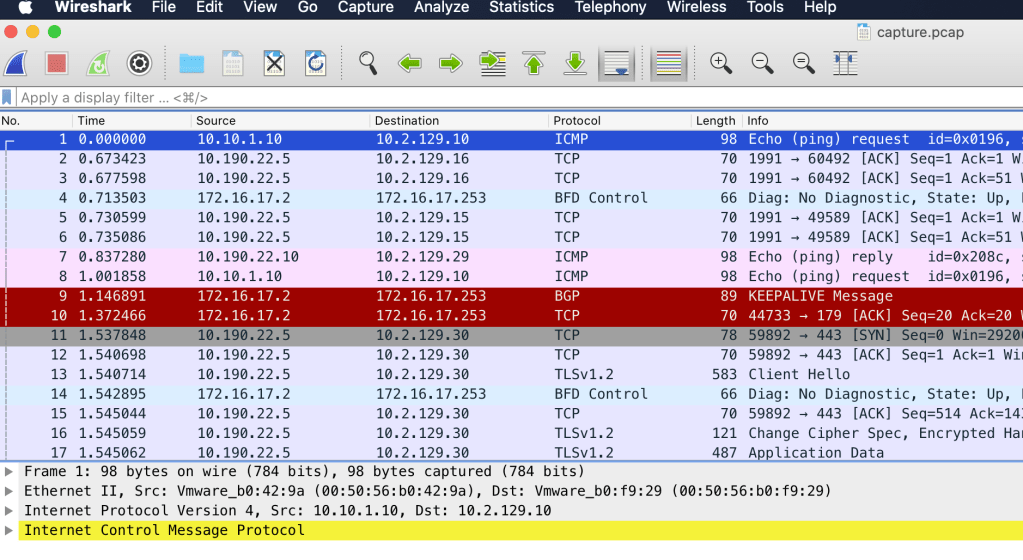
5 – Open capture file
Open the capture file in a packet analyzer like Wireshark to start investigating the captured packets:
Summary
And that’s how easy it is to capture traffic on Tier-0 uplinks.
It’s not uncommon that you need to capture network traffic as part of investigating some kind of application issue. For that reason I recommend that you document the IDs of the Tier-0 uplink interfaces in advance and have an SFTP server ready to go so that you don’t have to waste valuable time on preparing the packet capture itself.
Welcome back! We’re in the process of building an NSX-T Edge – FRRouting environment.
In part 1 we prepared the FRR routers by doing he following:
Installed two Debian Linux servers
Installed VLAN support
Enabled packet forwarding
Configured network interfaces
Installed and configured VRRP
Installed FRRouting
In this second part we will first deploy the NSX-T Edge components and then set up BGP routing. There’s a lot to do so let’s get started!
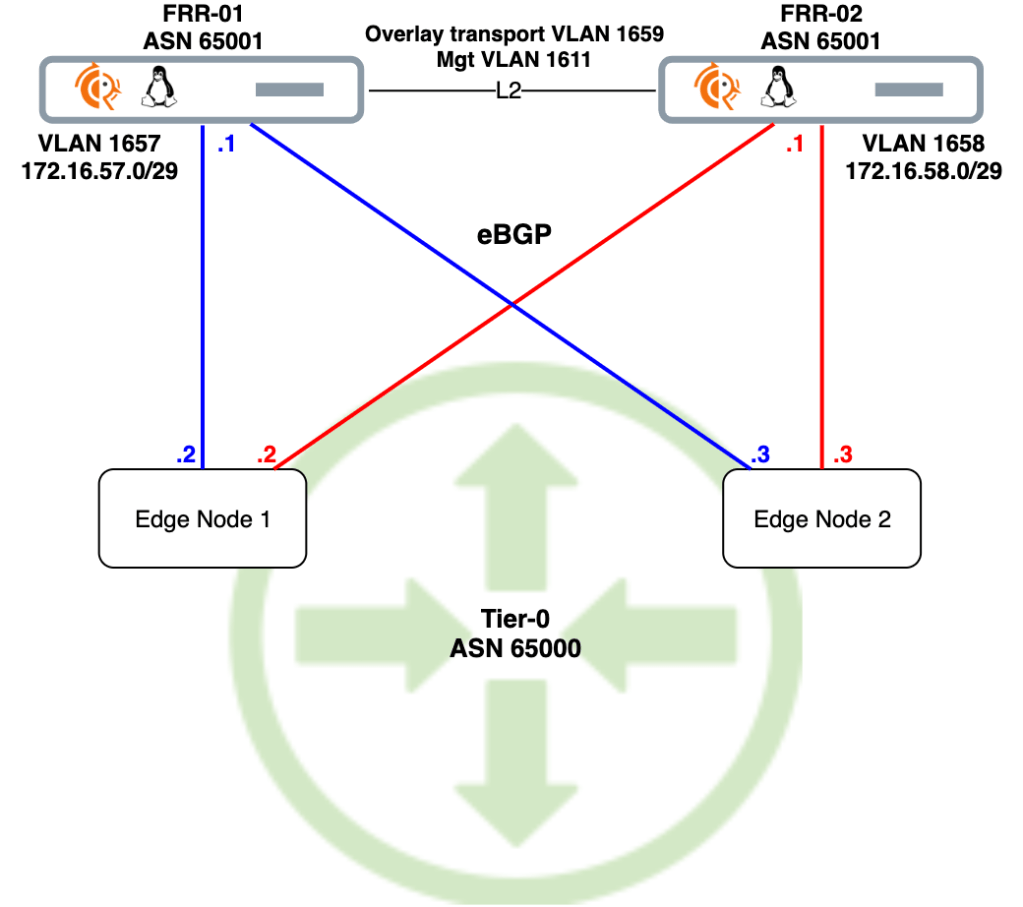
Target topology
As a refresher here is the big picture once more:
We’ll use this diagram as our blueprint. Scroll back up here any time you wonder what the heck it is we’re doing down there.
Deploy NSX-T Edge
Let’s begin by getting the NSX-T Edge on par with the FRR routers.
Create NSX-T segments
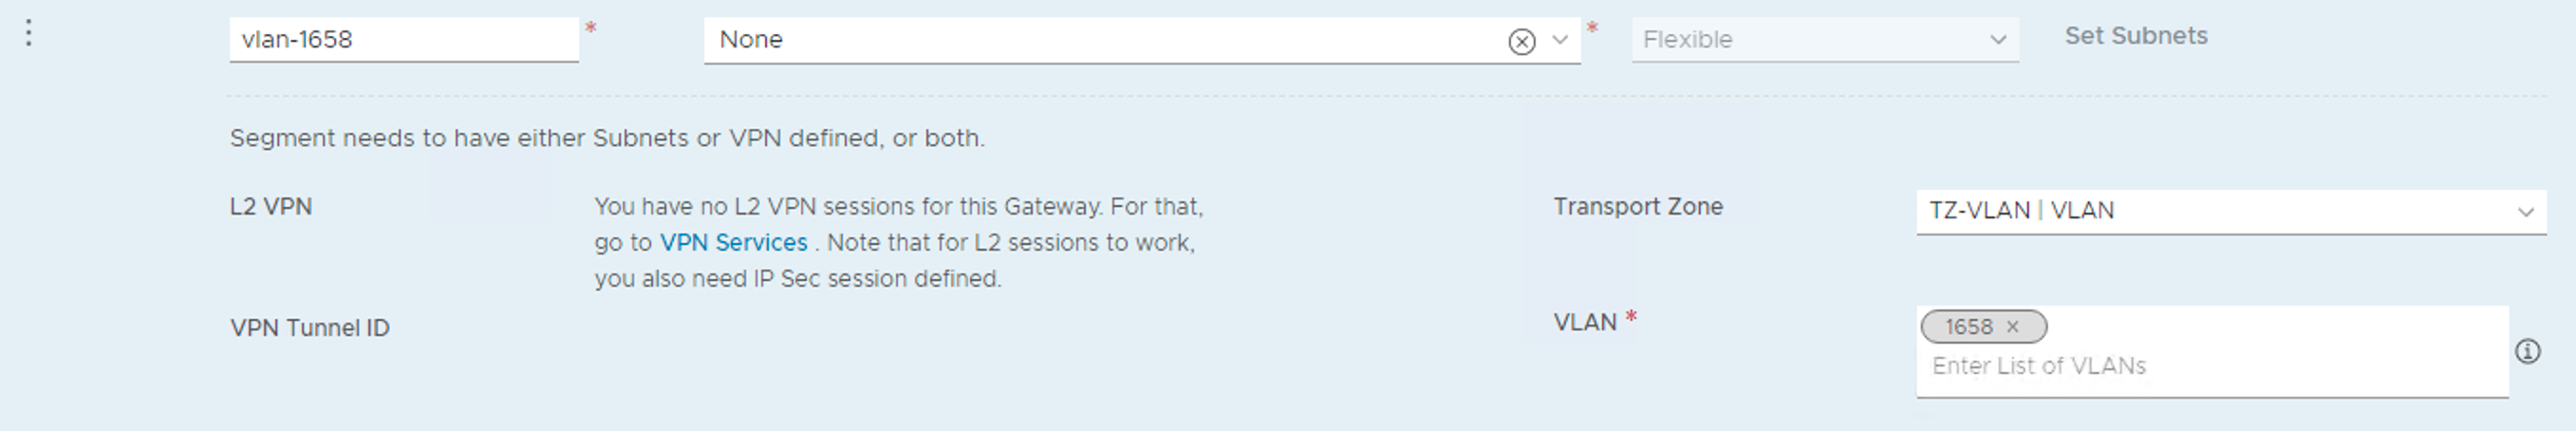
The FRR routers, frr-01 and frr-02, were configured with local “peering” VLANs 1657 and 1658 respectively. Corresponding VLAN-backed segments are needed for L2 adjacency with the FRR routers.
Creating the “vlan-1658” segment:
Both segments in place:
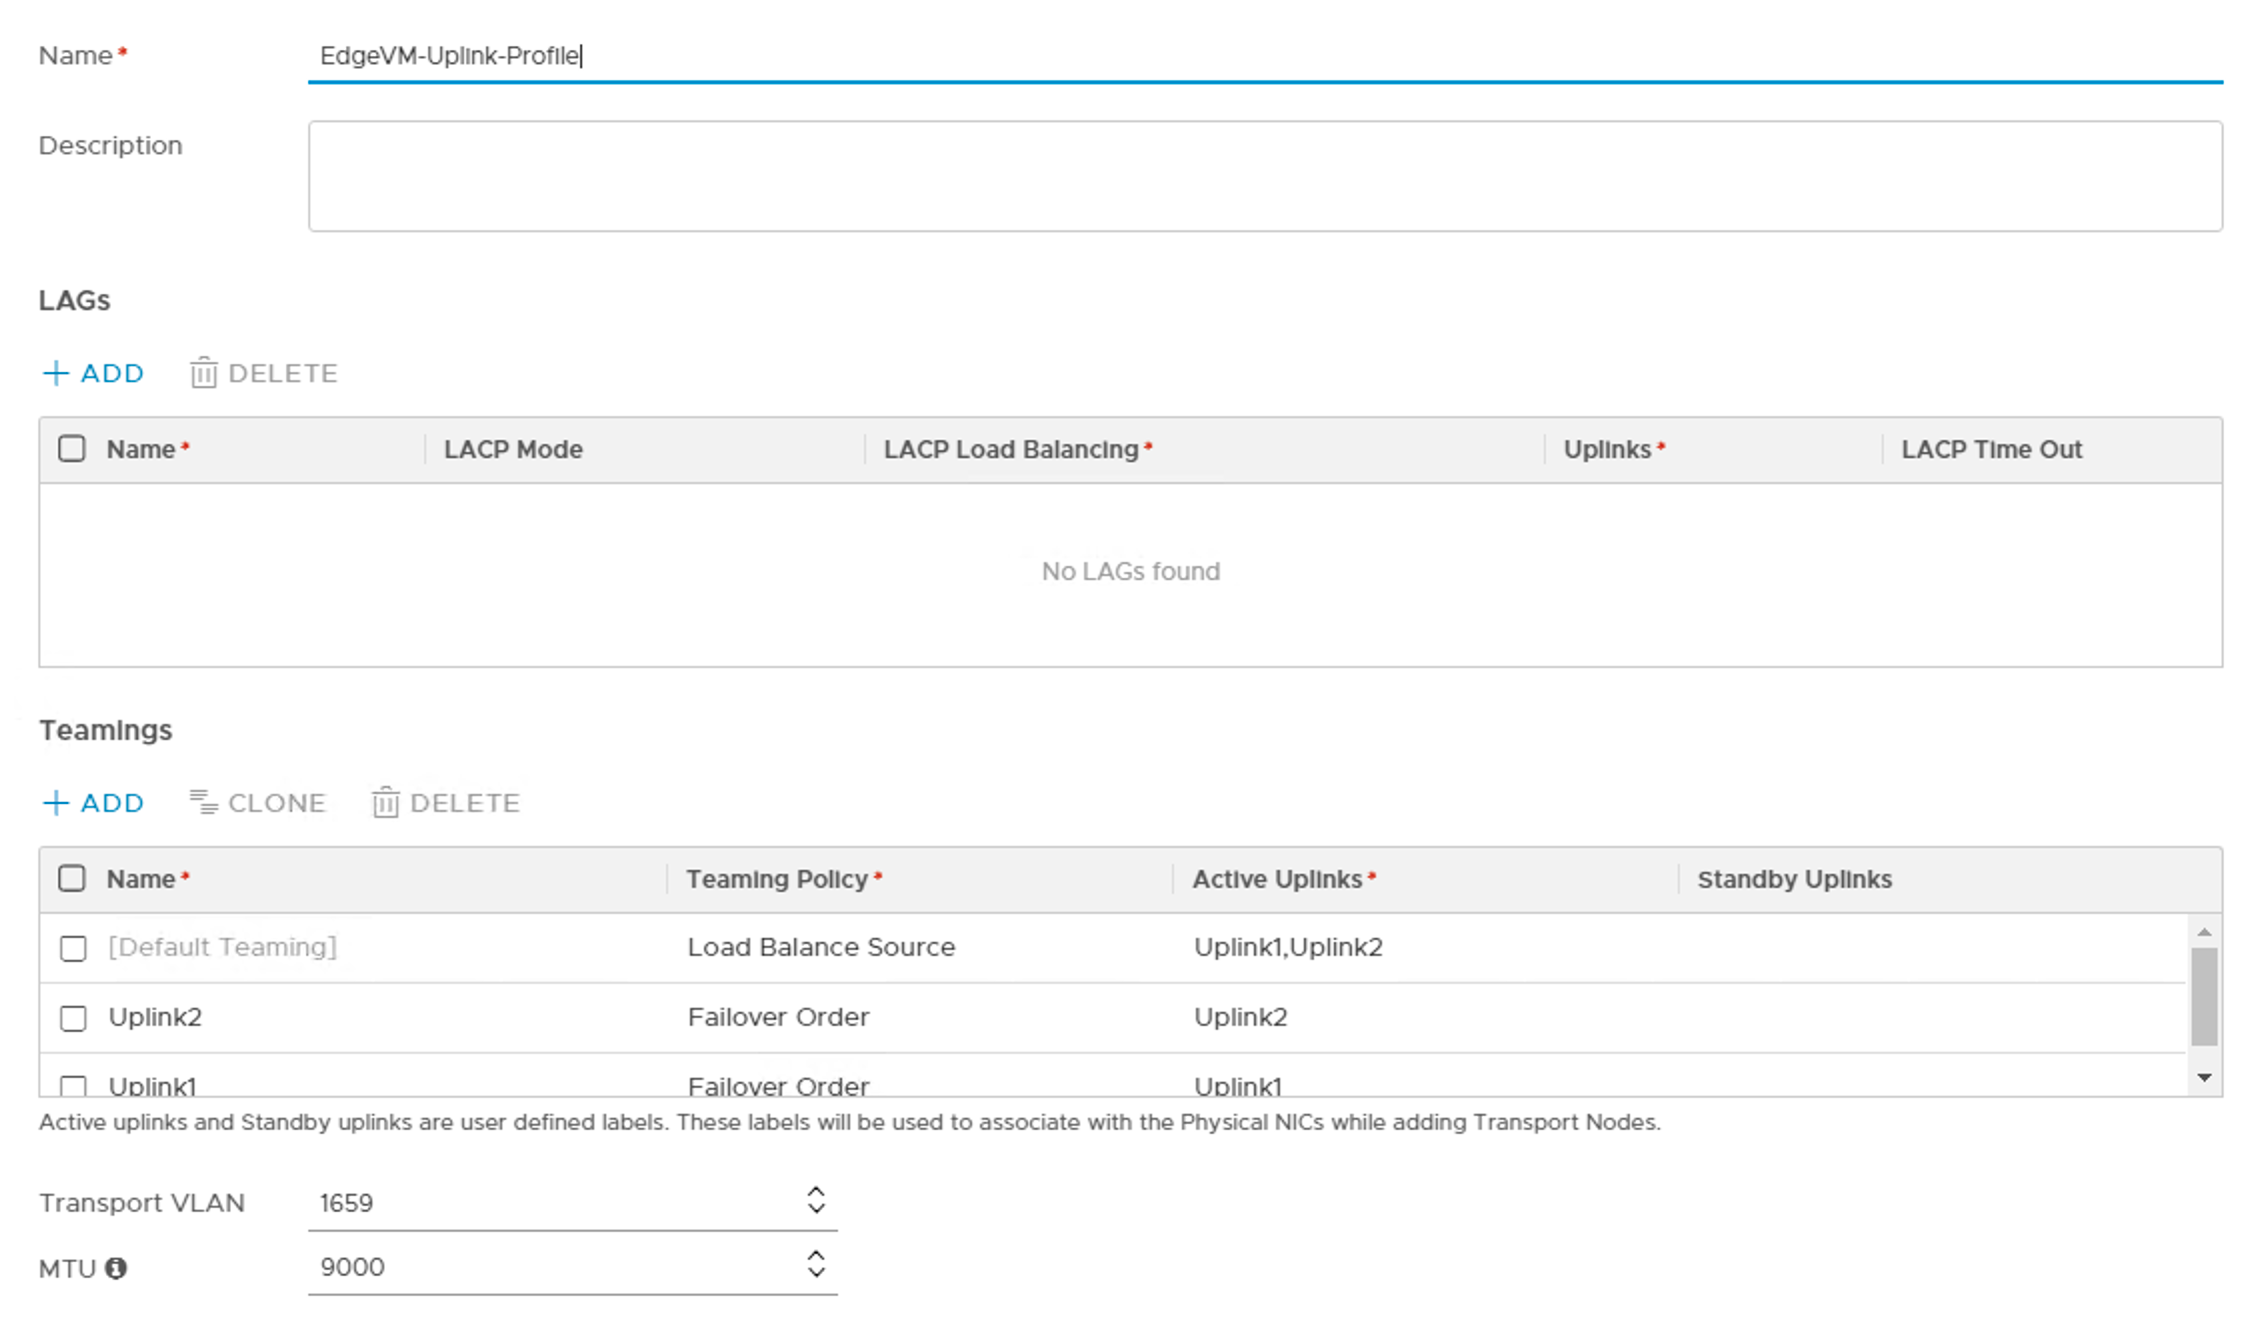
Uplink profile
Create an uplink profile for the edge transport nodes containing settings for teamings, transport VLAN, and MTU:
The transport VLAN has id 1659 and MTU size is 9000.
Deploy Edge VMs
Instead of walking through the Edge node deployment, the table below summarizes the settings I used during the deployment. Have a look at the Single N-VDS per Edge VM article for a detailed Edge node deployment walkthrough.
Setting
Edge Node 1
Edge Node 2
Name
en01
en02
FQDN
en01.lab.local
en02.lab.local
Form Factor
Small
Small
Mgmt IP
172.16.11.61/24
172.16.11.62/24
Mgmt Interface
PG-MGMT (VDS)
PG-MGMT (VDS)
Default Gateway
172.16.11.1
172.16.11.1
Transport Zone
TZ-VLAN, TZ-OVERLAY
TZ-VLAN, TZ-OVERLAY
Static IP List
172.16.59.71, 172.16.59.81
172.16.59.72, 172.16.59.82
Gateway
172.16.59.1
172.16.59.1
Mask
255.255.255.0
255.255.255.0
DPDK Interdace
Uplink1 > Trunk1 (VDS) Uplink2 > Trunk2 (VDS)
Uplink1 > Trunk1 (VDS) Uplink2 > Trunk2 (VDS)
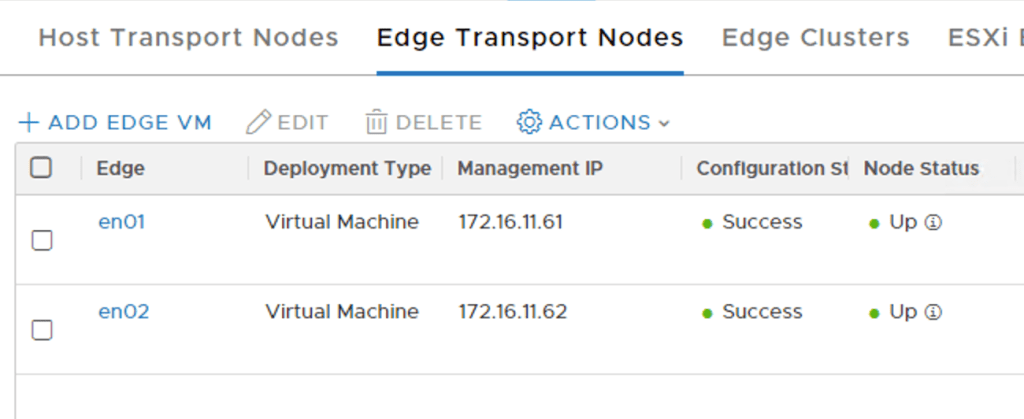
The two Edge nodes are up and running:
We add both Edge nodes to an Edge cluster:
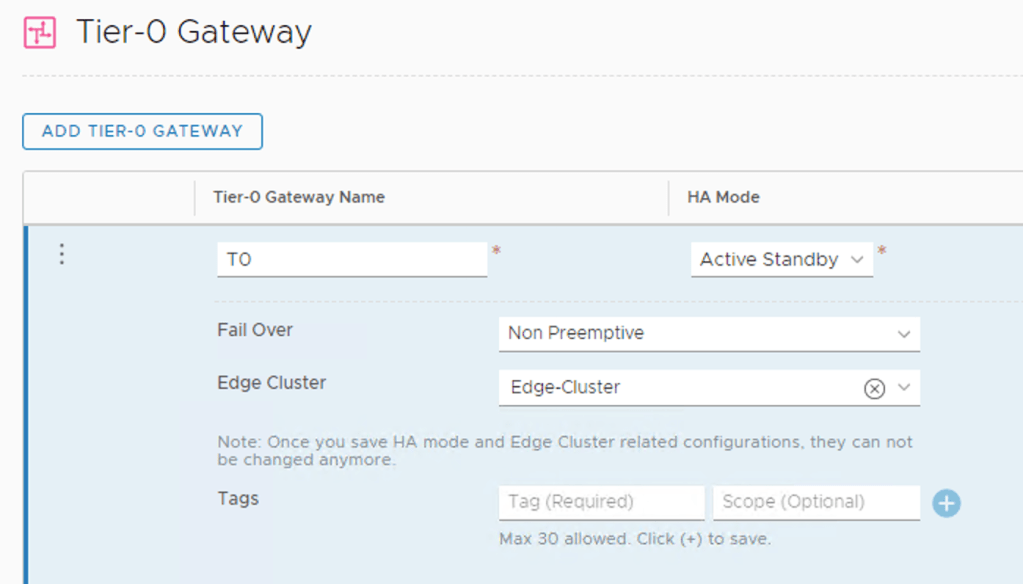
Create Tier-0 gateway
With the Edge nodes in place we can create a Tier-0 gateway. I’m configuring it with Active-Standby HA Mode:
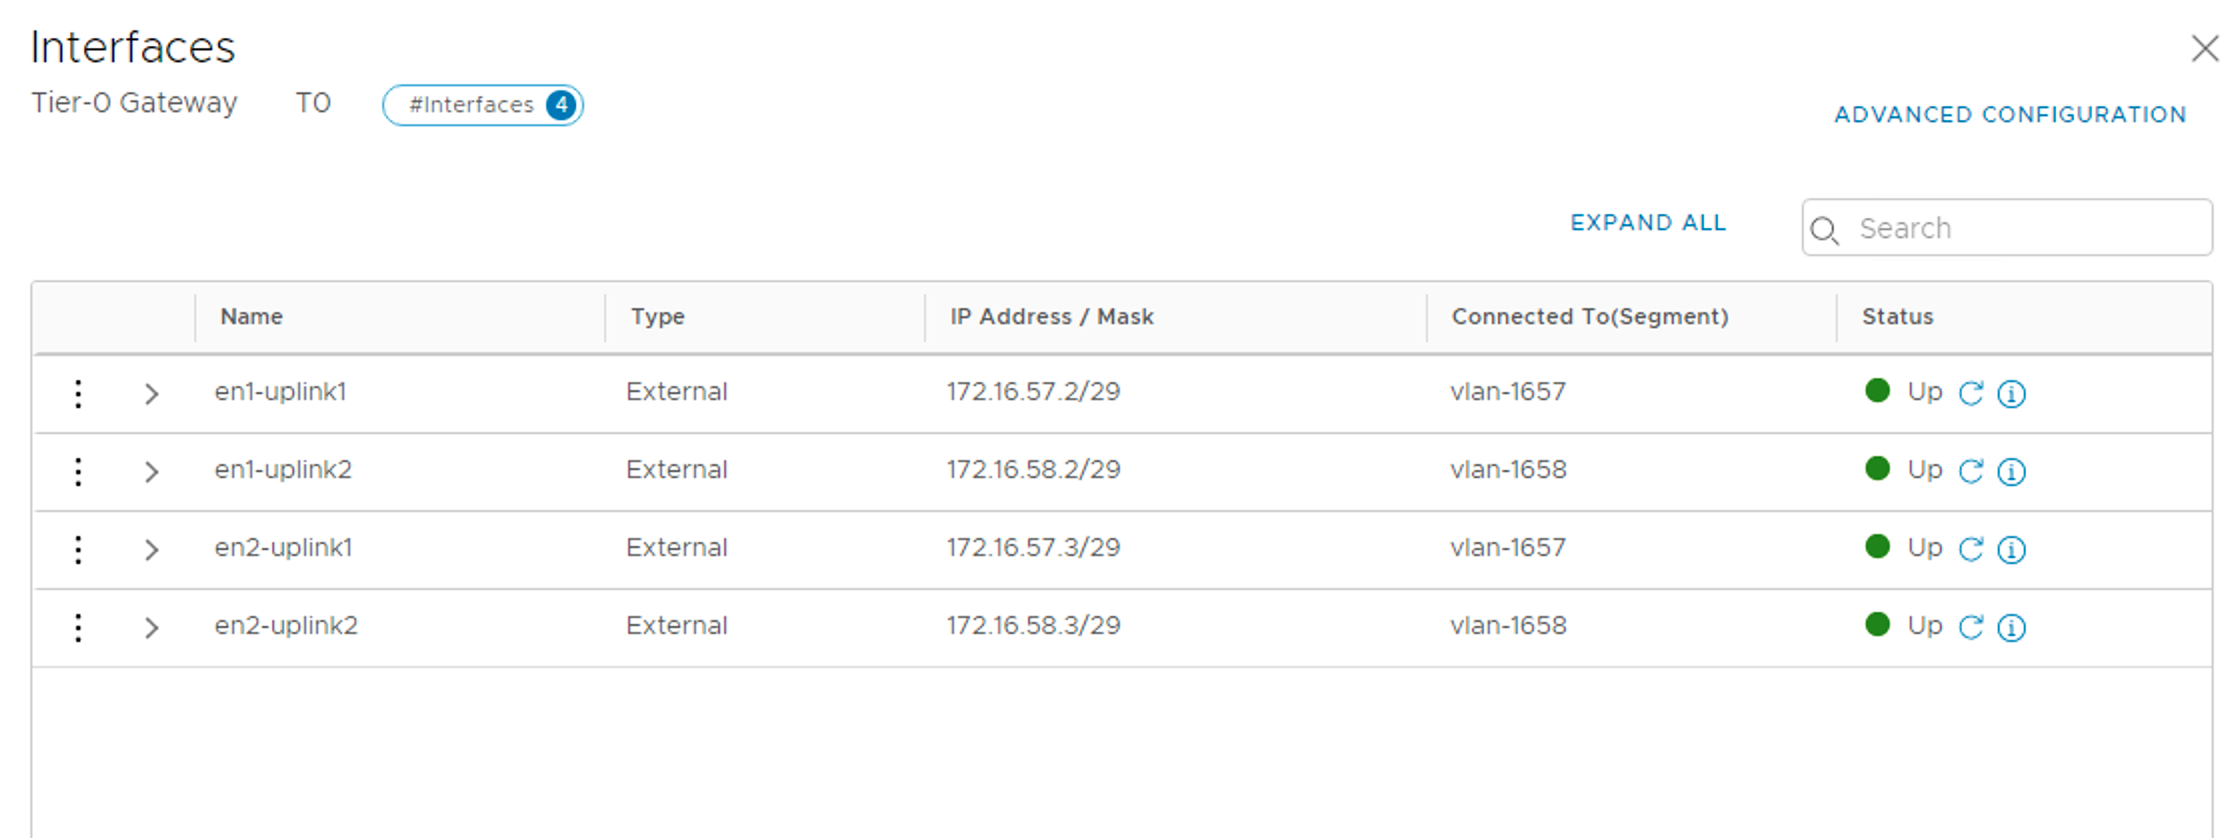
We add four external interfaces to the Tier-0:
Name
IP address
Segment
Edge Node
en1-uplink1
172.16.57.2/29
vlan-1657
en1
en1-uplink2
172.16.58.2/29
vlan-1658
en1
en2-uplink1
172.16.57.3/29
vlan-1657
en2
en2-uplink2
172.16.58.3/29
vlan-1658
en2
The four Tier-0 interfaces are in place:
Test connectivity
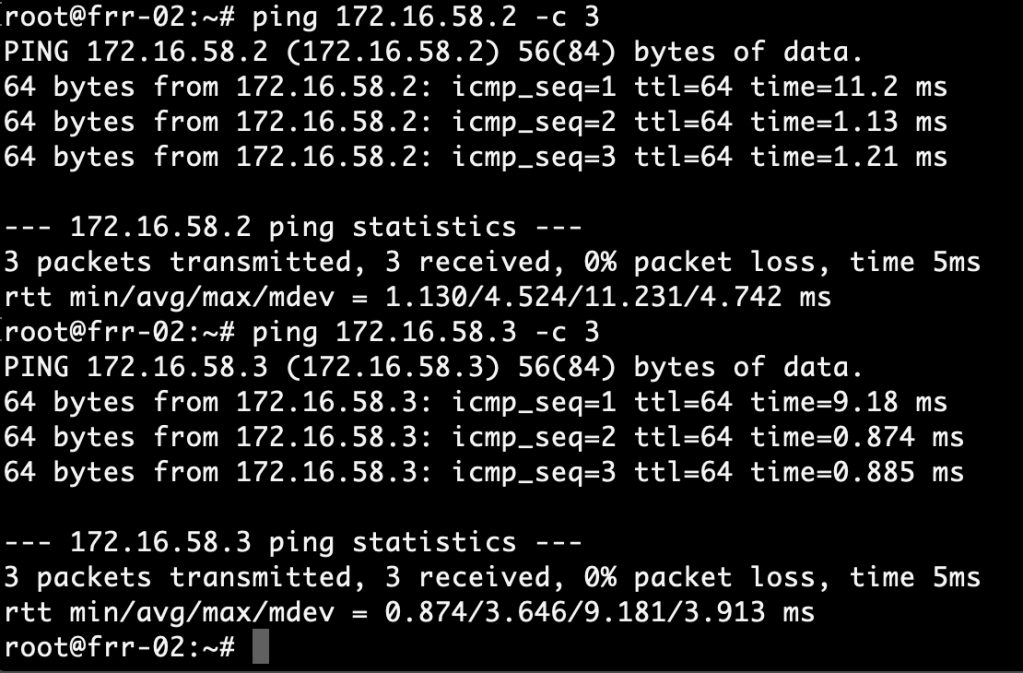
Now is a good time to verify the L2 adjacency between the FRR routers and the Tier-0 interfaces.
A ping from frr-01 to the Tier-0 interfaces in VLAN 1657:
And a ping from frr-02 to the Tier-0 interfaces in VLAN 1658:
Successful pings. We’re good!
Configure BGP
Moving up an OSI layer, we continue with setting up BGP.
Tier-0 gateway
The Tier-0 is configured with the following BGP settings:
Setting
Value
Local AS
65000
BGP
On
Graceful Restart
Disable
ECMP
On
The settings in NSX Manager:
We add two BGP neighbors to the Tier-0: 172.16.57.1 (frr-01) and 172.16.58.1 (frr-02). Make sure to enable BFD for these neighbors too:
The neighbor status will be “Down” at this point which is expected as we didn’t configure BGP on the FRR routers yet.
For route re-distribution I choose to re-distribute from all the available sources into the BGP process:
FRR routers
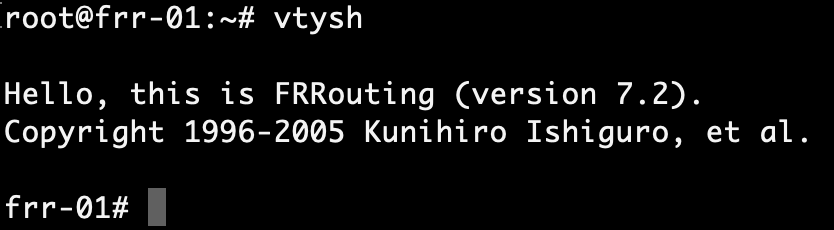
Configuration of BGP in FRRouting can be done by editing configuration files directly or through VTY shell which is FRRouting’s CLI frontend. We’ll use VTY shell today.
frr-01
Run the vtysh command to start VTY shell:
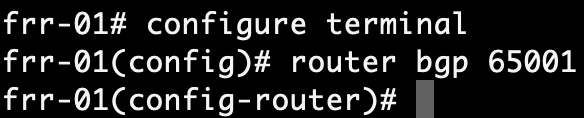
After changing to the configuration mode with conf t, we enable the BGP process with:
router bgp 65001
Next, we configure the router ID and the BGP/BFD neighbors which are the Tier-0’s interfaces in VLAN 1657 on frr-01:
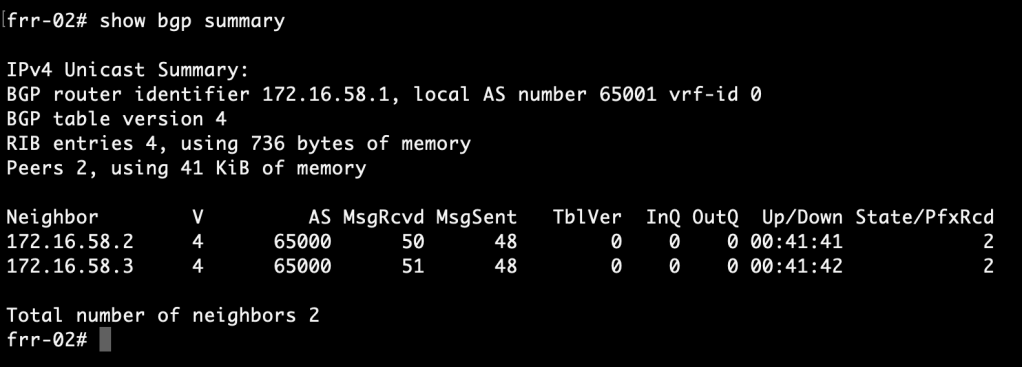
After a lot of deploying and configuring it’s finally time to see if we can actually route any traffic.
FRR routing tables
We begin by having a look at the FRR routing tables. Run the following command in VTY shell on the FRR routers:
show ip route bgp
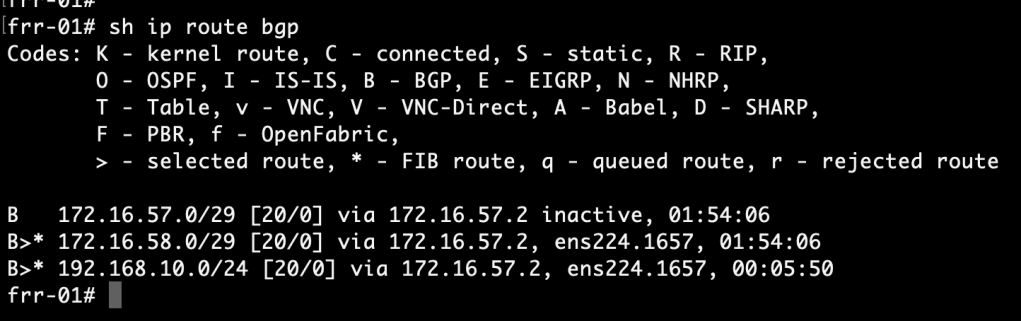
frr-01:
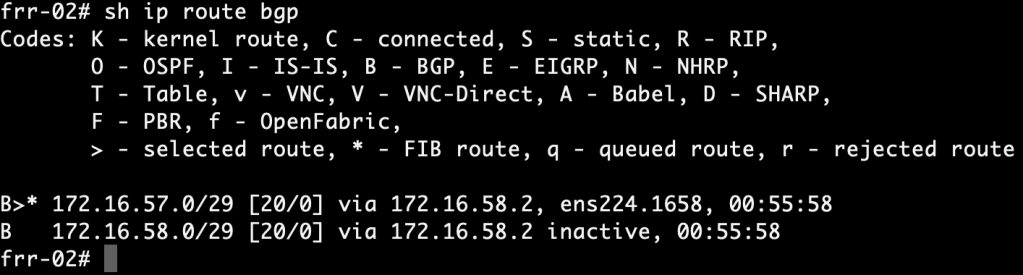
frr-02:
The FRR routers have learned about each other’s /29 subnets via the NSX-T Tier-0. More specifically, they were learned from neighbor 172.16.57.2 and 172.16.58.2. This tells us that the active Tier-0 SR is hosted on Edge node 1.
Is the standby Tier-0 SR completely out of the picture then? Let’s see:
show bgp detail
The standby Tier-0 SR on Edge node 2 also advertises routes for the same /29 subnets, but as you can see the ASN (65000) is added to the path three more times and packets won’t be routed over these longer paths.
Tier-0 routing table
Run the following command on the Edge node hosting the active Tier-0 SR:
get route bgp
Here we see two equal cost routes for 0.0.0.0/0, one to each FRR router. This tells us that “default-originate” did its job. Both routes also ended up in the FIB which means ECMP is working.
From overlay to physical
It’s now time for the ultimate test. We create an overlay segment, 192.168.10.0/24, connected to the Tier-0 gateway:
The BGP process on the Tier-0 advertises the 192.168.10.0/24 network to its neighbors. Let’s check if they ended up there:
show ip route bgp
frr-01:
frr-02:
A route to the overlay network is indeed present in both of the FRR routers routing table.
Now we connect a VM to the overlay segment and run a traceroute from this VM to an IP address north of the FRR routers:
traceroute 10.2.129.10 -n -q 2
The VM on the overlay segment can reach the physical network. By doing two probes per hop we also see that the Tier-0 offers two paths to the destination: one via frr-01 (172.16.57.1) and one via frr-02 (172.16.58.1).
It’s a wrap
It’s been quite a project, but we got ourselves a working NSX-T Edge – FRRouting environment and it wasn’t that hard to set up, right?
This all started with me looking for a more enterprise like virtual top-of-rack solution for my NSX-T lab. Having these FRR routers north of the Tier-0 certainly feels like a big step towards that goal. Perhaps not fully showcased in these articles, but FRRouting’s feature set is pretty much on par with today’s data center leaf-spine switches. As a matter of fact it’s already being used there. Have a look at Cumulus Networks for example.
For more information about features and possibilities surrounding BGP have a look at the official NSX-T and FRRouting documentation. Most of all I recommend that you set this up yourself. Hopefully these two articles will help you get started with that.
Until recently I always used pfSense with the OpenBGPD package as the NSX-T Edge counterpart in my lab environment. It’s quick and easy to set up and works well enough. But pfSense is not what I typically find in a customer’s production environment.
I started to investigate other virtualized “top-of-rack solutions” for the lab that would be a bit more similar to what I see in the enterprise. Right now I’m testing out FRRouting and I must say that I’m pretty impressed with this solution so far. At least it’s good enough to be the subject of a blog post or two 😉
I’m going to walk through deploying and configuring a pair of FRRouting instances, the NSX-T Edge, and BGP routing in a lab environment. Follow along if you want.
Target topology
The diagram below shows a logical L3 design for the NSX-T Edge – FRRouting solution that we’ll be building:
There’s nothing much out of the ordinary here. We have a Tier-0 gateway backed by two Edge nodes, and BGP routing. At the top of the diagram things look a bit less familiar with two Linux routers powered by FRRouting.
That’s a nice sketch. Now let’s see if we can make it work too.
Bill of materials
The following software is used to build this environment:
NSX-T 2.5.1
vSphere 6.7 U3
Debian Linux 10.2
FRRouting 7.2
Deploy FRRouting
This first part is about getting the FRR instances up and running which begins with installing two Linux servers. Let’s get right to it.
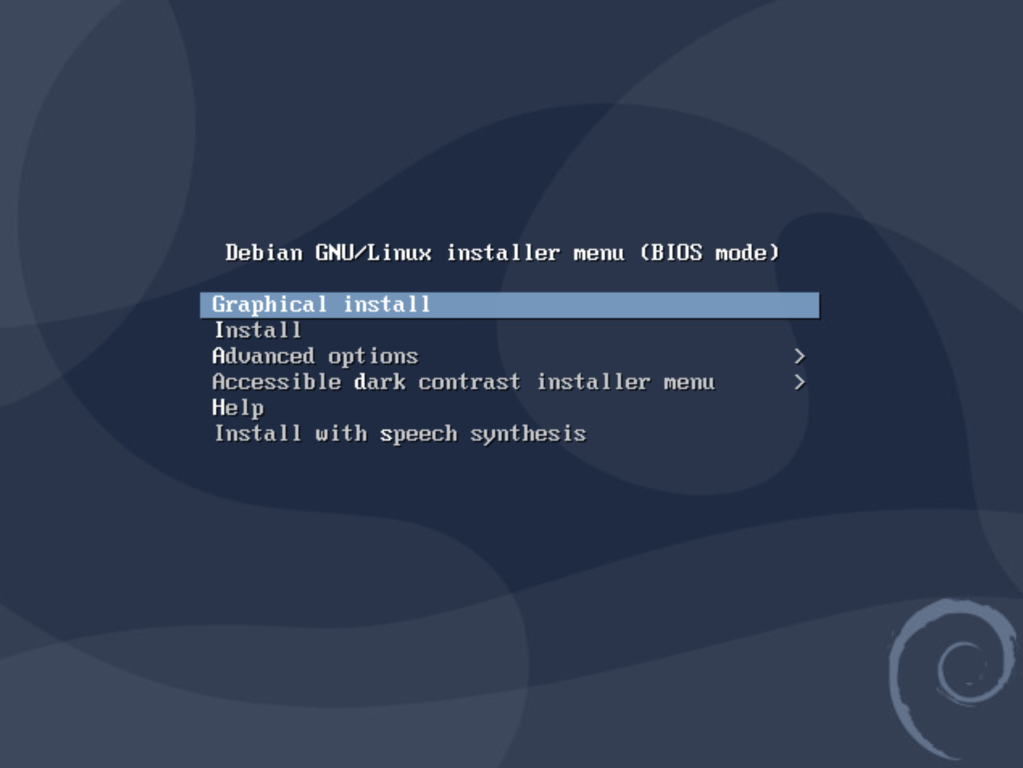
Install Linux servers
Debian Linux is a good fit here as there is an official FRR Debian repository which makes installing FRR a lot easier.
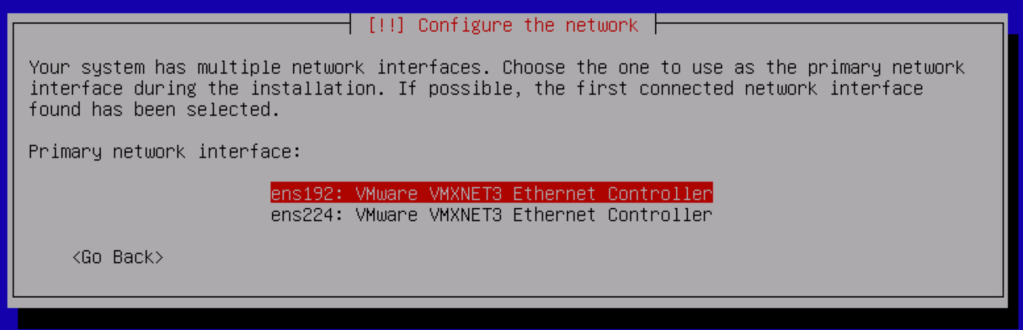
Each server is configured with two NICs.
The ens192 interface is configured as the primary interface and will be the “north-facing” port. The ens224 interface is the “SDDC-facing” port.
At this point we only assign a static IP address to the ens192 interface.
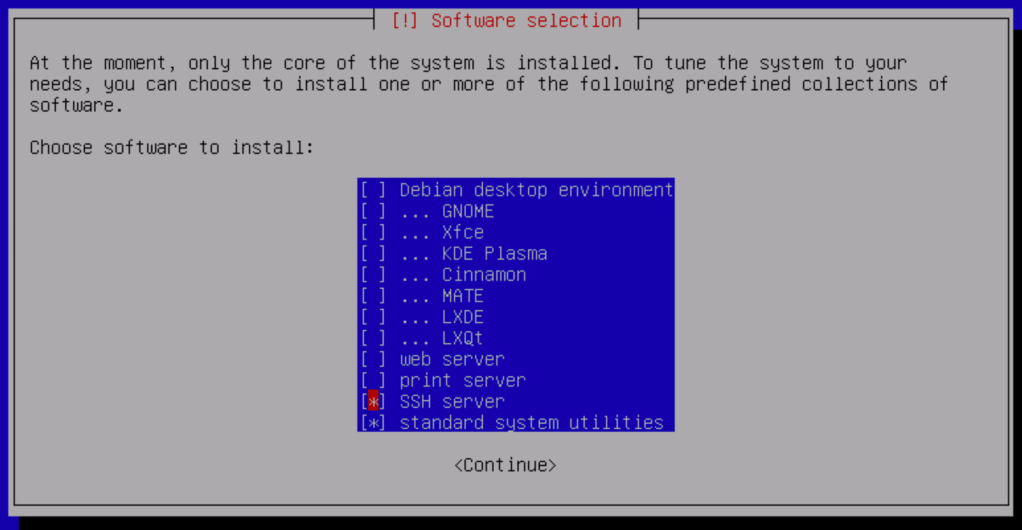
The only additional components we need to install are the SSH server and standard system utilities:
Complete the Debian installation on both servers.
Install VLAN support
The servers will soon be configured with some VLAN interfaces. To add support for this we install the VLAN package:
apt install vlan -y
Add the following line to /etc/modules so that VLAN (802.1Q) support is loaded during boot:
8021q
Enable IPv4 packet forwarding
We want the Linux servers to become Linux routers and as a part of that we need to enable IPv4 packet forwarding in /etc/sysctl.conf:
net.ipv4.ip_forward=1
Reboot the servers after making this change.
Configure network interfaces
Time to configure the network interfaces on the Linux routers. The following shows the interface configuration per Linux router:
frr-01:
Interface
IP address
Comment
ens192
10.2.129.101/24
Primary interface, north-facing
ens224
–
Secondary interface, SDDC-facing
ens224.1611
172.16.11.253/24
Management VLAN
ens224.1657
172.16.57.1/29
BGP peering VLAN
ens224.1659
172.16.59.253/24
Overlay transport VLAN
Which results in the following /etc/network/interfaces for frr-01:
source /etc/network/interfaces.d/*

# The loopback network interface
auto lo
iface lo inet loopback

# The primary network interface - north-facing port
auto ens192
allow-hotplug ens192
iface ens192 inet static
address 10.2.129.101/24
gateway 10.2.129.1
dns-nameservers 10.2.129.10
dns-search demo.local

# The secondary network interface - SDDC-facing port
auto ens224
allow-hotplug ens224
iface ens224 inet manual
mtu 9000

# The VLAN 1611 interface - Management
auto ens224.1611
iface ens224.1611 inet static
address 172.16.11.253/24

# The VLAN 1657 interface - BGP peering
auto ens224.1657
iface ens224.1657 inet static
address 172.16.57.1/29

# The VLAN 1659 interface - Overlay transport
auto ens224.1659
iface ens224.1659 inet static
address 172.16.59.253/24
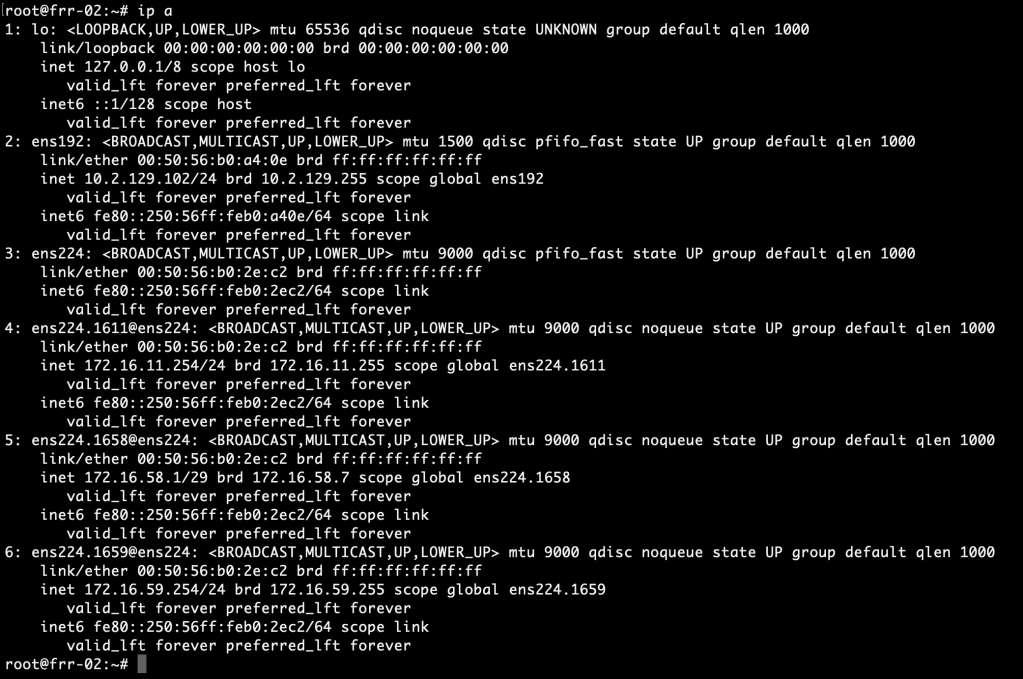
frr-02:
Interface
IP address
Comment
ens192
10.2.129.102/24
Primary interface, north-facing
ens224
–
Secondary interface, SDDC-facing
ens224.1611
172.16.11.254/24
Management VLAN
ens224.1658
172.16.58.1/29
BGP peering VLAN
ens224.1659
172.16.59.254/24
Overlay transport VLAN
The corresponding /etc/network/interfaces for frr-02:
source /etc/network/interfaces.d/*

# The loopback network interface
auto lo
iface lo inet loopback

# The primary network interface - north-facing
auto ens192
allow-hotplug ens192
iface ens192 inet static
address 10.2.129.102/24
gateway 10.2.129.1
dns-nameservers 10.2.129.10
dns-search demo.local

# The secondary network interface - SDDC-facing
auto ens224
allow-hotplug ens224
iface ens224 inet manual
mtu 9000

# The VLAN 1611 interface - Management
auto ens224.1611
iface ens224.1611 inet static
address 172.16.11.254/24

# The VLAN 1658 interface - BGP peering
auto ens224.1658
iface ens224.1658 inet static
address 172.16.58.1/29

# The VLAN 1659 interface - Overlay transport
auto ens224.1659
iface ens224.1659 inet static
address 172.16.59.254/24
Restart the network to activate the new network interface configuration:
systemctl restart networking
Run the ip address command to verify that the new interface configuration is active:
Install VRRP
As you noticed we are “stretching” the management VLAN (1611) and the overlay transport VLAN (1659) between the Linux routers. Both routers can act as the default gateway for these VLANs at any given time. To make use of this capability we’ll set up VRRP with Keepalived.
Install the package:
apt install keepalived -y
Create the Keepalived configuration file: /etc/keepalived/keepalived.conf. Below the Keepalived configuration per server:
frr-01 (VRRP master):
global_defs {
# Email Alert Configuration
notification_email {
# Email To Address
admin@demo.local
}
# Email From Address
notification_email_from noreply@demo.local
# SMTP Server Address / IP
smtp_server 127.0.0.1
# SMTP Timeout Configuration
smtp_connect_timeout 60
router_id frr-01
}

vrrp_sync_group VG1 {
group {
1611
1659
}
}

vrrp_instance 1611 {
# State = Master or Backup
state MASTER
# Interface ID for VRRP to run on
interface ens224.1611
# VRRP Router ID
virtual_router_id 10
# Highest Priority Wins
priority 250
# VRRP Advert Intaval 1 Second
advert_int 1
# Basic Inter Router VRRP Authentication
authentication {
auth_type PASS
auth_pass VMware1!VMware1!
}
# VRRP Virtual IP Address Config
virtual_ipaddress {
172.16.11.1/24 dev ens224.1611
}
}

vrrp_instance 1659 {
# State = Master or Backup
state MASTER
# Interface ID for VRRP to run on
interface ens224.1659
# VRRP Router ID
virtual_router_id 11
# Highest Priority Wins
priority 250
# VRRP Advert Intaval 1 Second
advert_int 1
# Basic Inter Router VRRP Authentication
authentication {
auth_type PASS
auth_pass VMware1!VMware1!
}
# VRRP Virtual IP Address Config
virtual_ipaddress {
172.16.59.1/24 dev ens224.1659
}
}
frr-02 (VRRP backup):
global_defs {
# Email Alert Configuration
notification_email {
# Email To Address
admin@demo.local
}
# Email From Address
notification_email_from noreply@demo.local
# SMTP Server Address / IP
smtp_server 127.0.0.1
# SMTP Timeout Configuration
smtp_connect_timeout 60
router_id frr-02
}

vrrp_sync_group VG1 {
group {
1611
1659
}
}

vrrp_instance 1611 {
# State = Master or Backup
state BACKUP
# Interface ID for VRRP to run on
interface ens224.1611
# VRRP Router ID
virtual_router_id 10
# Highest Priority Wins
priority 150
# VRRP Advert Intaval 1 Second
advert_int 1
# Basic Inter Router VRRP Authentication
authentication {
auth_type PASS
auth_pass VMware1!VMware1!
}
# VRRP Virtual IP Address Config
virtual_ipaddress {
172.16.11.1/24 dev ens224.1611
}
}

vrrp_instance 1659 {
# State = Master or Backup
state BACKUP
# Interface ID for VRRP to run on
interface ens224.1659
# VRRP Router ID
virtual_router_id 11
# Highest Priority Wins
priority 150
# VRRP Advert Intaval 1 Second
advert_int 1
# Basic Inter Router VRRP Authentication
authentication {
auth_type PASS
auth_pass VMware1!VMware1!
}
# VRRP Virtual IP Address Config
virtual_ipaddress {
172.16.59.1/24 dev ens224.1659
}
}
Restart the Keepalived service on both routers to activate the new configuration:
systemctl restart keepalived
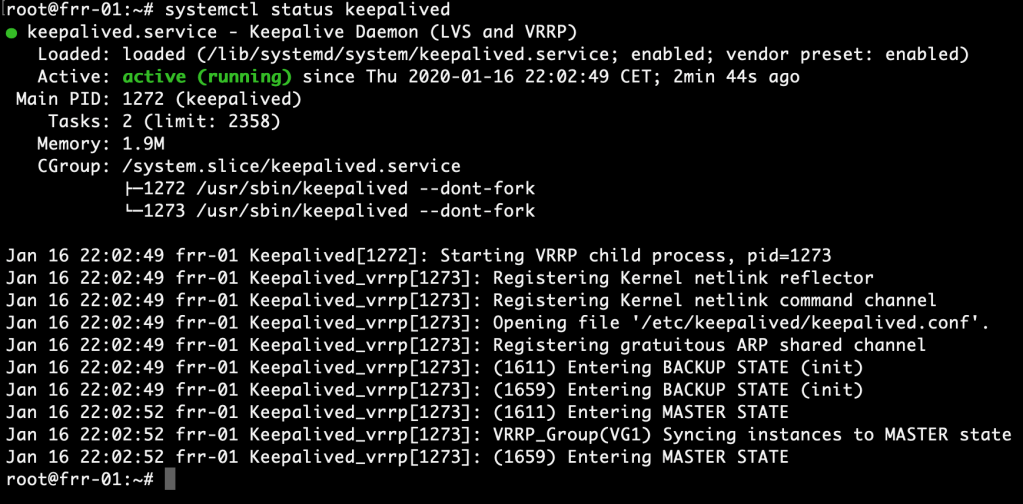
We can now verify VRRP operation by running systemctl status keepalived:
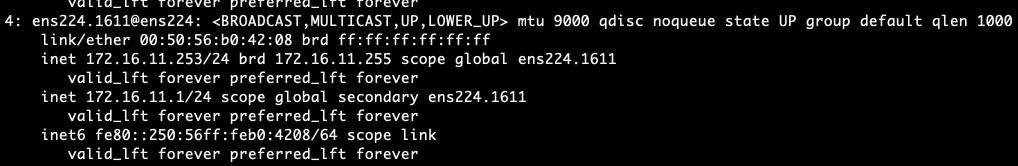
Running the ip address command will hopefully show the virtual IP address on the two VLAN interfaces:
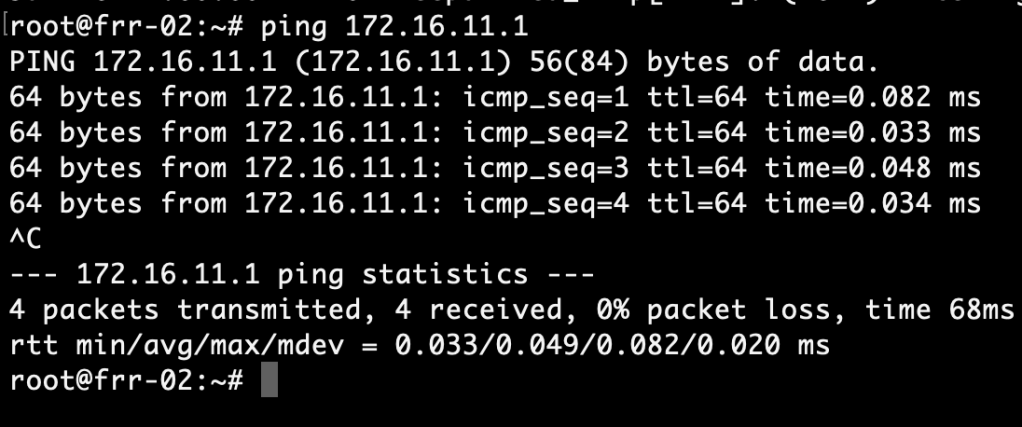
And a ping to the virtual IP address from the VRRP backup node (frr-02 in this case) should be successful:
Install FRRouting
With Linux installed and configured we continue with the FRRouting installation.
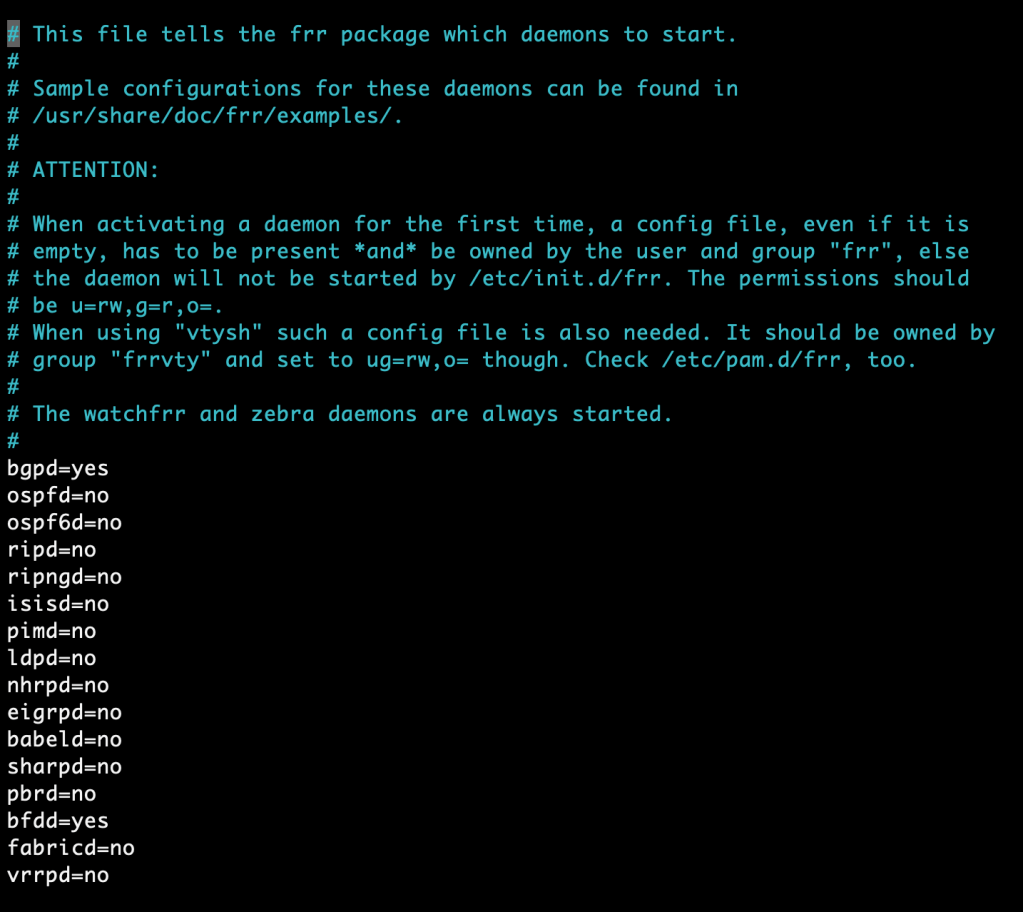
We only enable the routing protocols that are needed. To make FRR a good match for the NSX-T Edge we would like the instances to be capable of doing BGP and BFD. So we simply enable these daemons in /etc/frr/daemons.
bgpd=yes
bfdd=yes
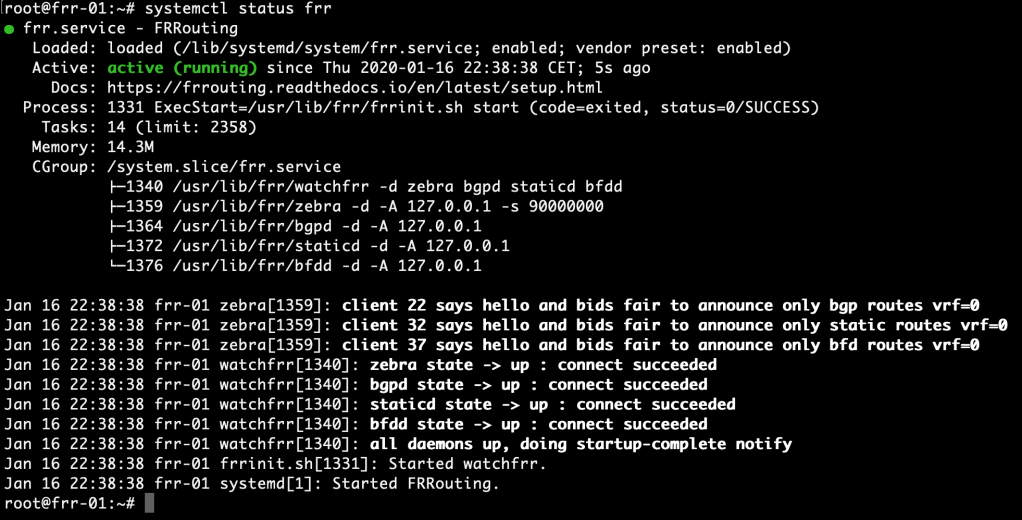
Restart the FRR service and verify that the BGP and BFD daemons are active:
systemctl restart frr
systemctl status frr
This is looking good. The FRR instances are now ready for control plane configuration.
Summary
This completes part 1 of the series on NSX-T and FRRouting. We’ve been quite productive:
Installed two Debian Linux servers
Installed VLAN support
Enabled packet forwarding
Configured network interfaces
Installed and configured VRRP
Installed FRRouting
In the next part we’ll continue with deploying the NSX-T Edge and setting up BGP routing between NSX-T and the FRR instances. Thanks for reading and stay tuned!
When it comes to AWS VPN the most common use case is establishing secure Site-to-Site connections between the customer’s data center and a Virtual Private Cloud (VPC).
As an exercise for myself I decided to configure a Site-to-Site VPN connection between an NSX-T Tier-1 gateway and an AWS VPC and in today’s article I’m walking through the process of setting this up.
Target topology
Let’s begin with a simple diagram showing the logical environment and the scenario that I cooked up for myself:
A database server (db01) in the data center needs to regularly dump its database to an EC2 instance (db-backups). The database server is connected to a segment which is attached to a Tier-1 gateway. The EC2 instance is connected to a private subnet in a Virtual Private Cloud (VPC).
The requirement is that only “segment-db” in the data center should be allowed to access the VPC private subnet using an encrypted connection over the Internet.
This sounds like a reasonable realistic scenario at least, right? Let’s set this up.
Configuring AWS
I begin by configuring the AWS side using the AWS Management Console.
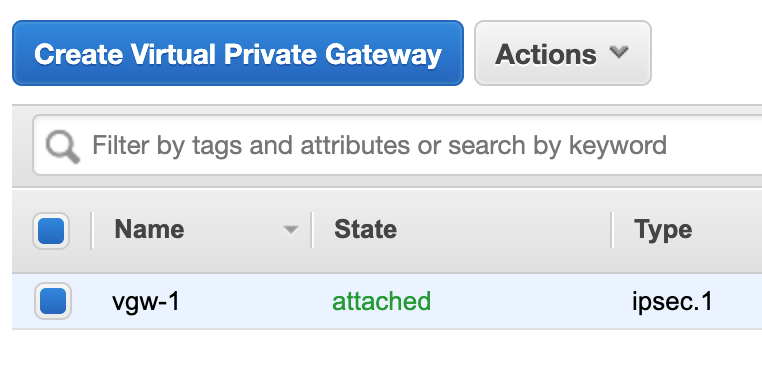
Virtual Private Gateway
First of all I need a Virtual Private Gateway (VGW) and attach it to my VPC. This is a matter of some clicks and requires minimal configuration:
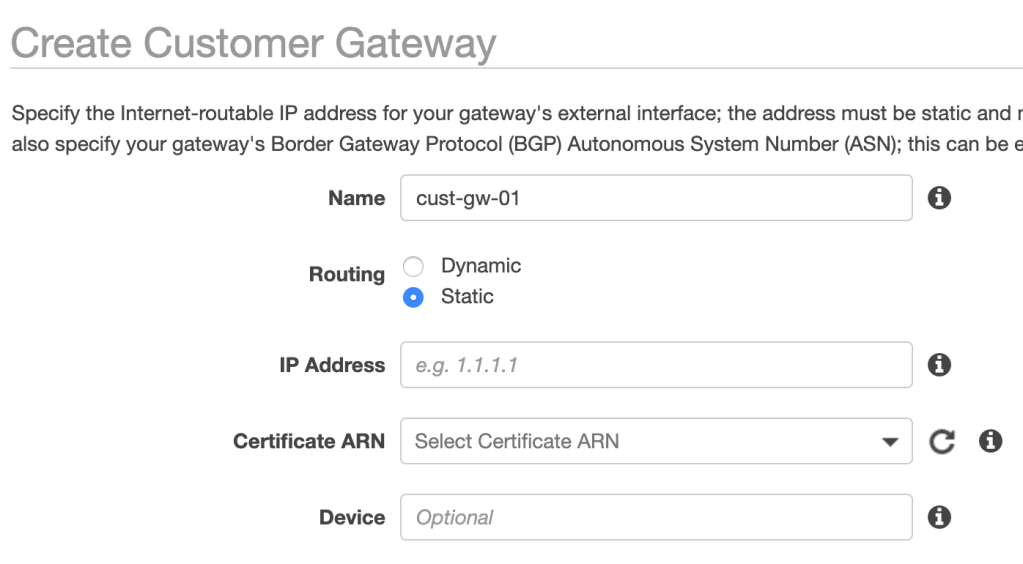
Customer Gateway
Next up is a Customer Gateway. This is a logical construct representing the VPN “device” on the data center side:
I’m selecting static routing and enter the public IP address of the VPN endpoint on the data center side. This can be a NAT-ed IP address.
VPN Connection
The third and last component is a VPN Connection:
Here I choose the newly created VGW and Customer Gateway. I also select static routing and add the 10.10.1.0/24 prefix which matches the “segment-db” subnet.
At this point Site-to-Site VPN on the AWS side is configured and ready:
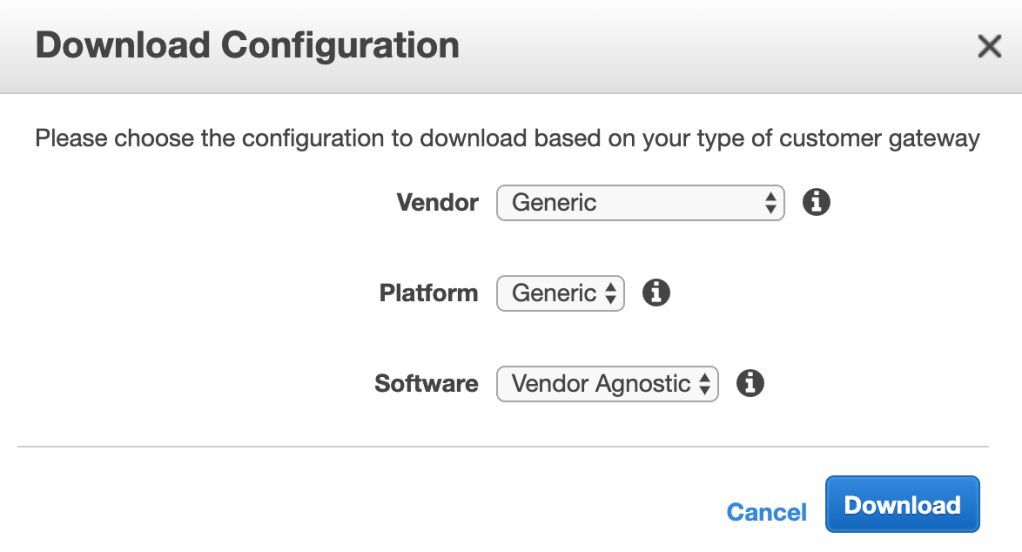
Configuration file
I download the vendor generic configuration file which contains all the settings for the VPN connection. This file might come in handy when configuring NSX-T:
Route propagation
One last thing before heading over to the data center is a small modification to the private subnet’s route table so that route propagation from the VGW is enabled. In my case this effectively adds a route for 10.10.1.0/24 with the VGW as target.
Configuring NSX-T
With the AWS side ready to rock n’ roll I will continue with the configuration of the NSX-T side.
VPN Profiles
I begin by creating profiles for IKE, IPSec, and DPD. This is done under Networking > Network Services > VPN > Profiles. The profiles contain settings that match the ones in the downloaded configuration file.
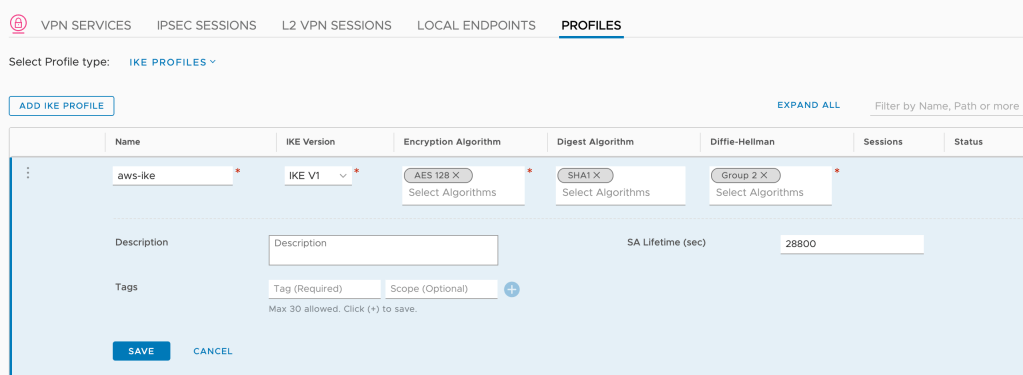
For the IKE profile I use the following settings:
Setting
Value
Name
aws-ike
IKE version
IKE V1
Encryption Algorithm
AES 128
Digest Algorithm
SHA1
Diffie-Hellman
Group 2
SA Lifetime (sec)
28800
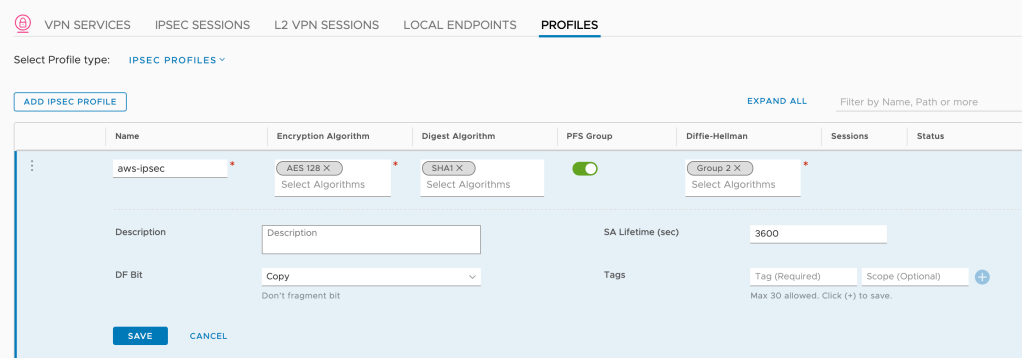
The IPSec profile looks like this:
Setting
Value
Name
aws-ipsec
Encryption Algorithm
AES 128
Digest Algorithm
SHA1
PFS
Enabled
Diffie-Hellman
Group 2
SA Lifetime (sec)
3600
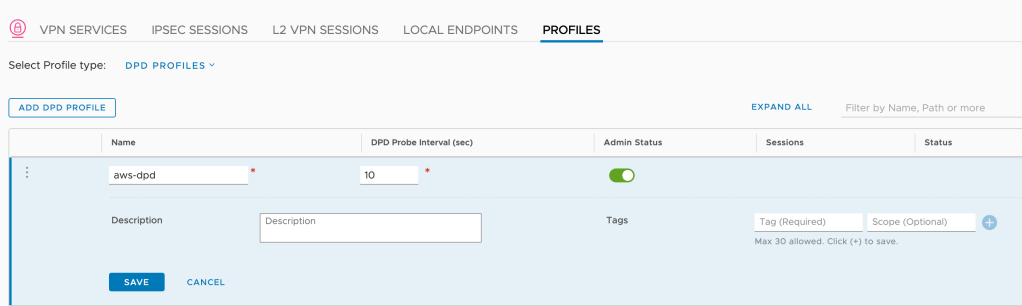
And finally the DPD profile:
Setting
Value
Name
aws-dpd
DPD Probe Interval (sec)
10
Note 1: I actually don’t have to create these profiles as the built-in “Foundation” (IKE and IPSec) and “nsx-default-l3vpn-dpd-profile” profiles work fine with AWS IPSec VPN, but I prefer having my own profiles.
Note 2: The IKE/IPSec/DPD settings in my profiles are fine for my little lab exercise. In the real world you want to consider other, possibly more secure settings.
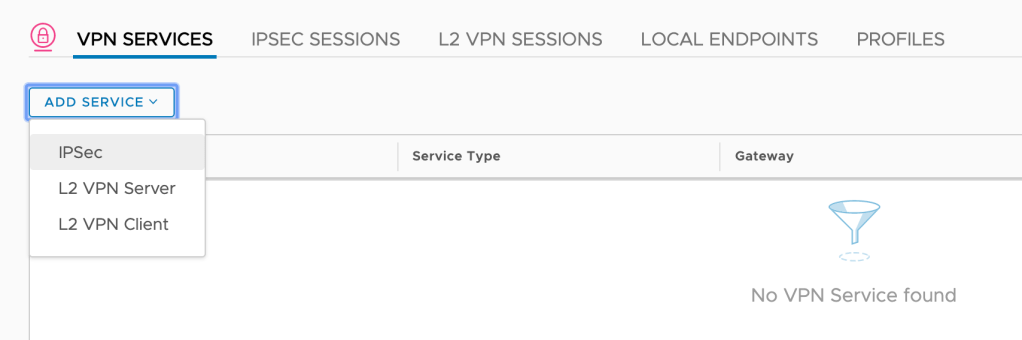
VPN Service
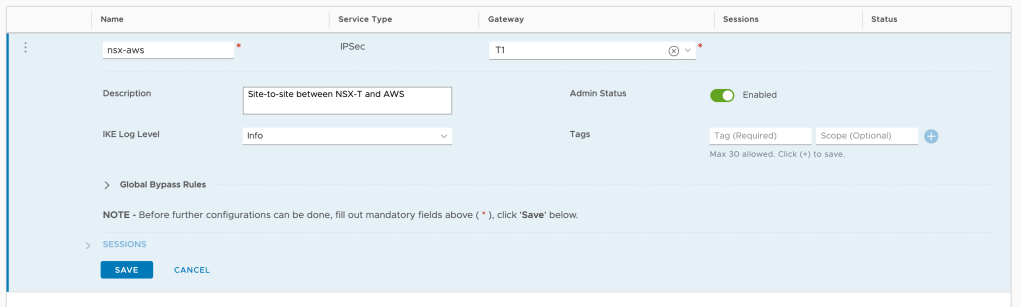
With the VPN profiles in place I move over to VPN Services and add a new IPSec service:
Very little needs to be configured here. A name (nsx-aws), a description perhaps, but most importantly a gateway. Starting with NSX-T 2.5 IPSec VPN can be configured on a Tier-1 gateway which is exactly what I want to do here:
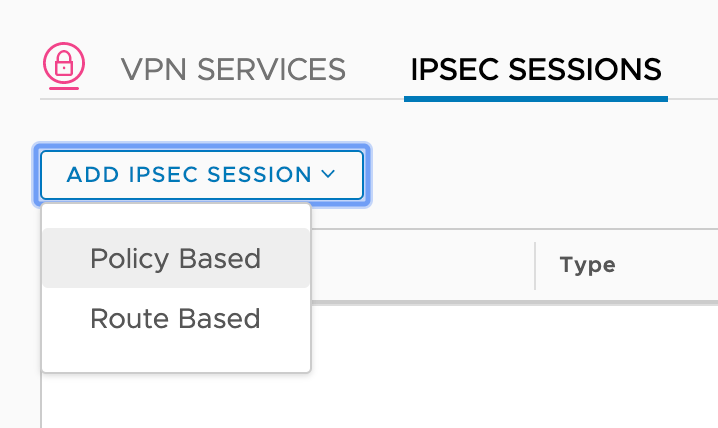
IPSec Session
The last piece of configuration that I need to add is a Policy Based IPSec session which is done under IPSec Sessions:
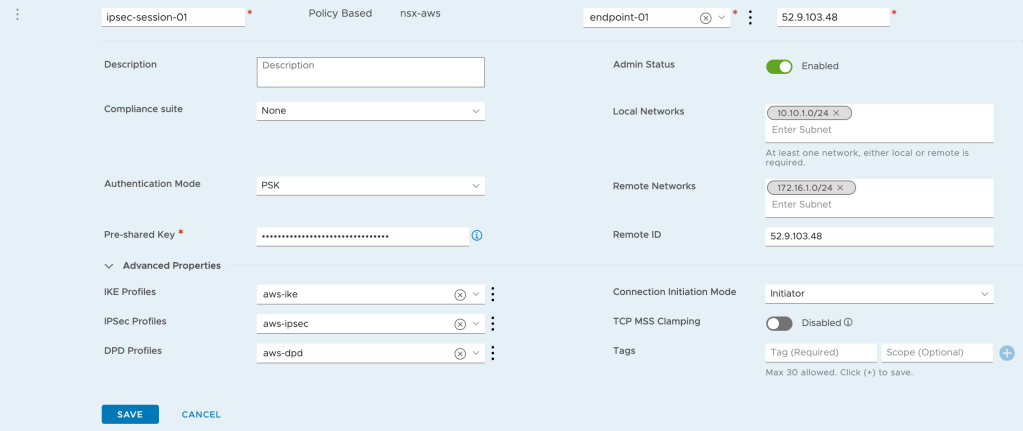
The IPSec session is configured with the following settings:
Setting
Value
Name
ipsec-session-01
VPN Service
nsx-aws
Local Endpoint
endpoint-01
Remote IP
public IP of the AWS VGW
Authentication Mode
PSK
Pre-shared Key
PSK is in the downloaded configuration file
IKE Profiles
aws-ike
IPSec Profiles
aws-ipsec
DPD Profiles
aws-dpd
Local Networks
10.10.1.0/24
Remote Networks
172.16.1.0/24
Connection Initiation Mode
Initiator
Quite a few settings here but most of them are self explanatory.
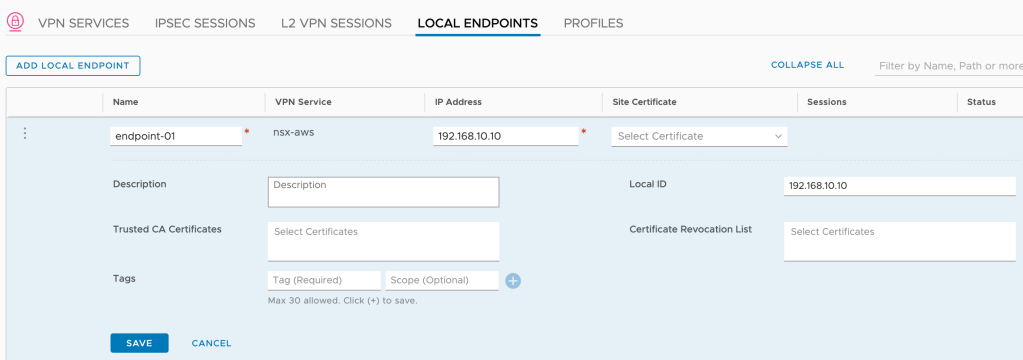
Local Endpoint
Except for “Local Endpoint” perhaps, which I created while configuring the IPSec session.
The local endpoint serves as the VPN tunnel’s endpoint on the NSX-T side. Its IP address is assigned to the loopback interface within the Tier-1 Service Router (SR) component. This IP address needs to be unique and reachable throughout the network meaning it needs to be advertised by the Tier-1 and then distributed by the Tier-0.
On the Tier-1 gateway I make sure that “All IPSec Local Endpoints” is enabled under “Route Advertisement”:
On the Tier-0 gateway I select “IPSec Local Endpoint” under “Advertised Tier-1 Subnets”:
A quick peek at the physical router’s route table shows me there’s now a host route to the local endpoint (192.168.10.10/32):
Verify VPN connection
Now that the AWS and the NSX-T sides are configured, I should have a functional Site-to-Site VPN connection between the two environments. Let’s verify.
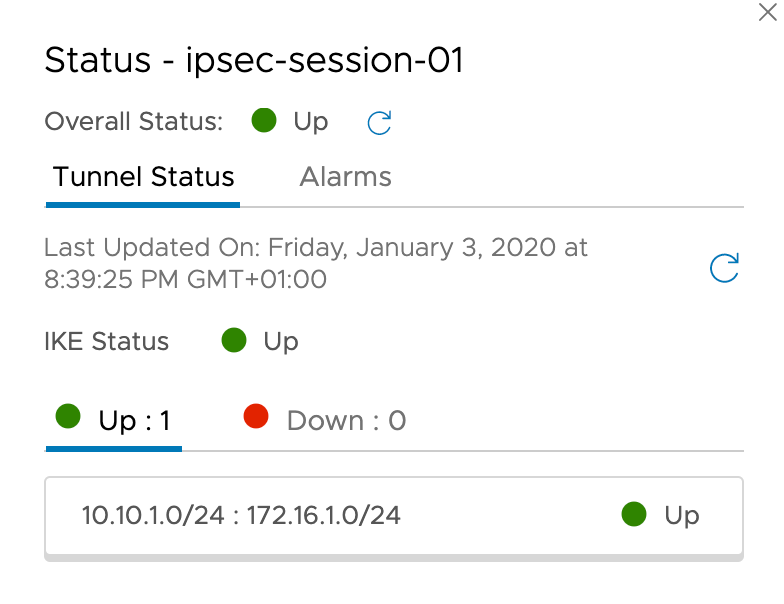
The IPSec tunnel status is looking good in the NSX Manager UI:
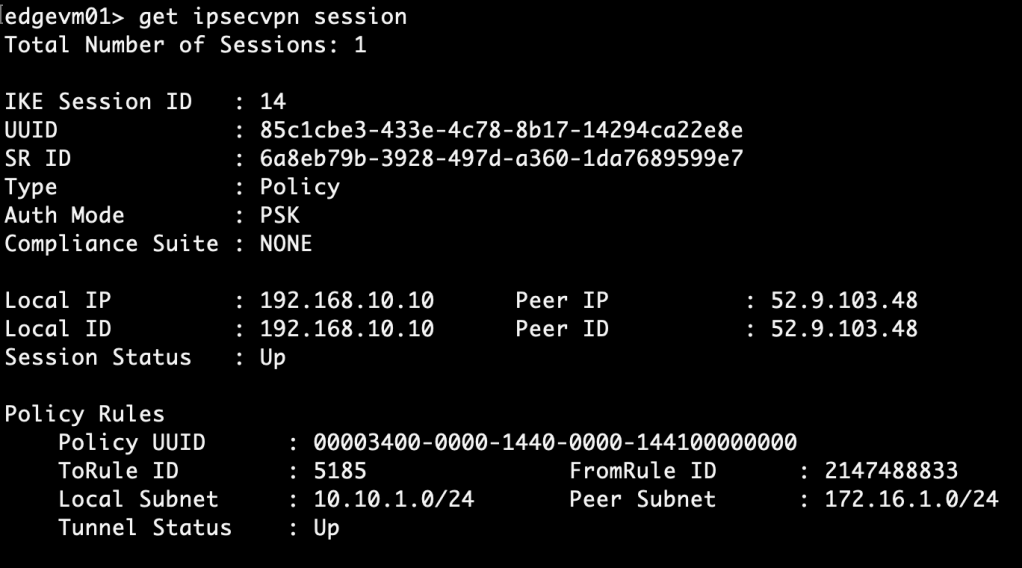
Some more details about IPSec sessions can be fetched on the Edge node CLI using the “get ipsecvpn” command. For example:
get ipsecvpn session
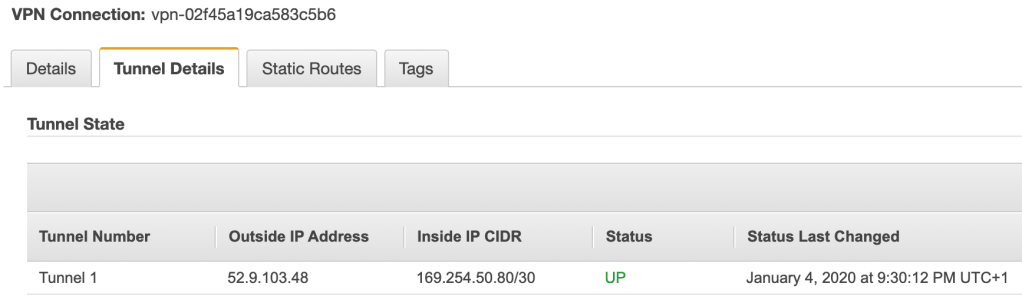
On the AWS side the tunnel status for the first tunnel has changed to “Up”:
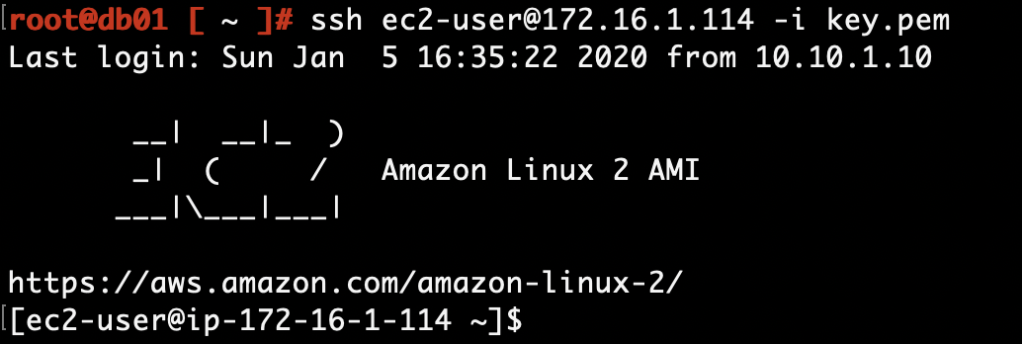
I seem to have an operational Site-to-Site VPN connection. Time for the ultimate test: Can “db01” connect to the EC2 instance?
It can indeed. Mission accomplished!
API
For faster provisioning of the NSX-T VPN configuration I can use the API instead.
A while back Dumlu Timuralp published an excellent guide on integrating NSX-T 2.5 with K8s. If you haven’t read it already I strongly recommend that you have a look at it. The guide goes through every step of configuring the integration and does a great job explaining the architecture and components that make up this solution.
Today’s article is a quick walkthrough of my NSX-T integrated K8s lab which is based on Dumlu’s guide.
Bill of materials
The following components are used in my NSX-T – K8s lab:
vSphere 6.7 U3
NSX-T 2.5.1
Ubuntu 18.04
Docker CE 18.06
Kubernetes 1.16
The lab environment
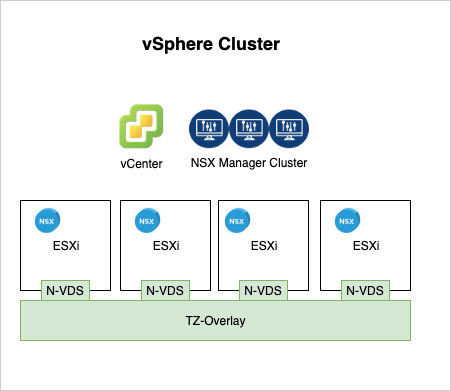
The starting point before setting up the K8s integration:
A standard vSphere platform consisting of a couple of ESXi hosts and a vCenter server. NSX-T has been deployed and an overlay transport zone has been configured.
On the logical network side of things I have a very basic setup with just a Tier-0 gateway for the North-South connectivity.
The above infrastructure is pretty much always in place and mostly left untouched. The components for the NSX-T – K8s integration are connected to this existing infrastructure. Let’s have a look at how that’s done.
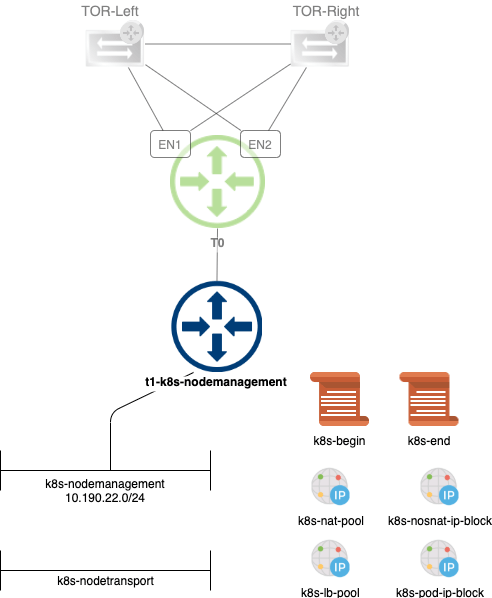
NSX-T constructs
A couple of NSX-T constructs are needed for the K8s integration:
Tier-1 gateway for K8s node management
Segment for K8s node management
Segment for K8s node data plane
IP block for K8s namespaces
IP block for K8s namespaces not doing source NAT
IP pool for K8s Ingress or LoadBalancer service type
IP pool for source NATing K8s Pods in the namespaces
Two distributed firewall policies
Placing the components on the diagram for some clarity:
Nothing too complex, but creating and configuring this by hand takes some time. Especially when doing this many times, which is not uncommon in my lab, it gets boring.
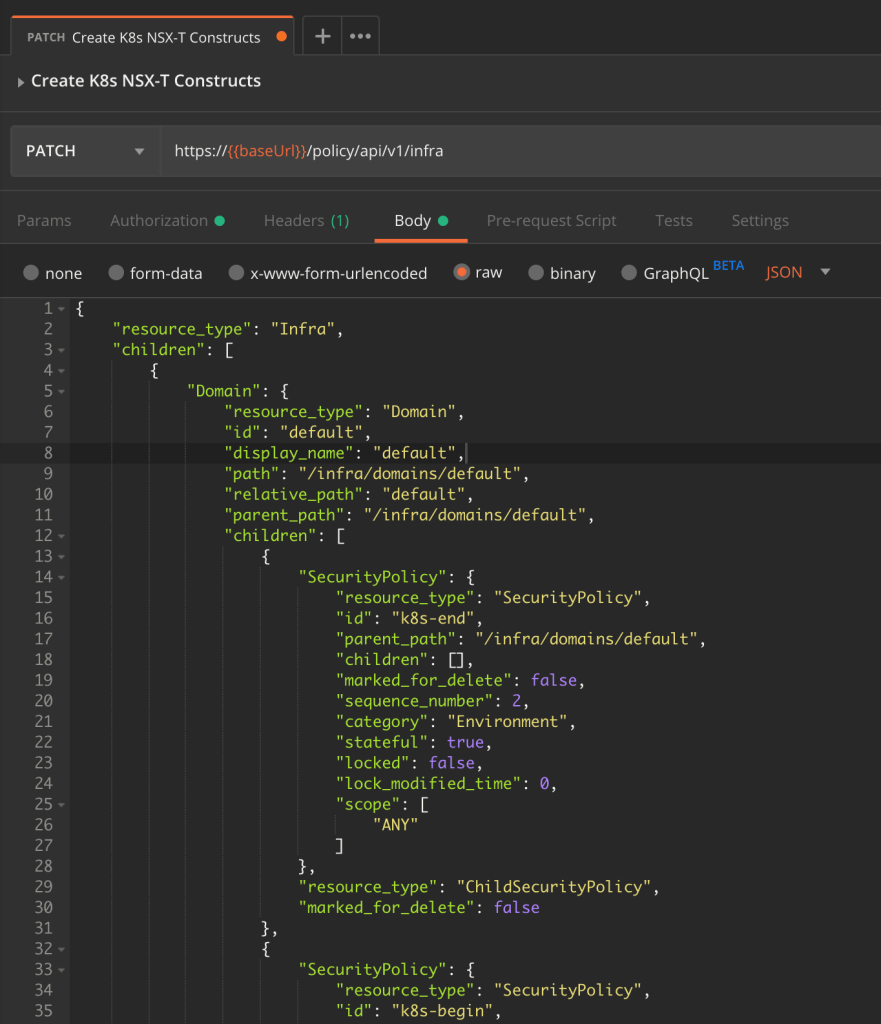
Luckily, the NSX-T hierarchical policy API helps me out here. I simply specify the desired topology and its configuration as a piece of code and then tell the API to create it for me.
So here’s the JSON-code for the topology and components above. If you want to use it yourself make sure that you change the values for:
tier0_path – the path to your Tier-0 gateway
transport_zone_path – the path to your overlay transport zone
I send this code as the body of a PATCH request to:
PATCH https://<nsx-mgr>/policy/api/v1/infra
And in a matter of seconds the components are in place.
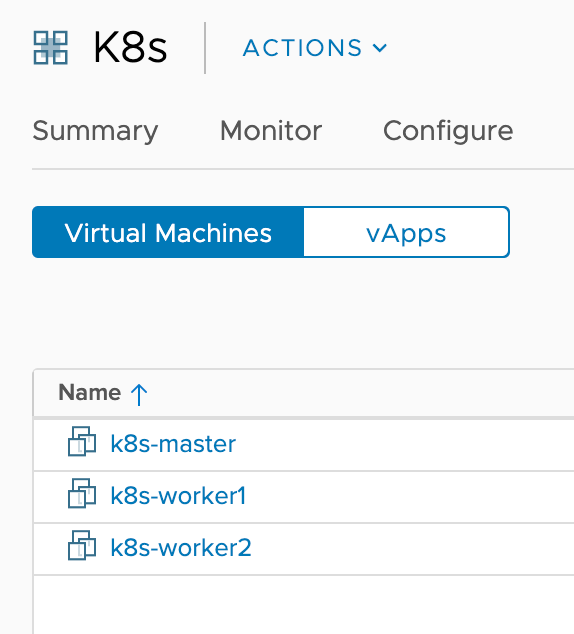
Ubuntu VMs
On the compute side my K8s cluster consists of three Ubuntu VMs: A master and two worker nodes. Each VM is configured with two NICs where one connects to the “k8s-nodetransport” segment and the other to the “k8s-nodemanagement” segment:
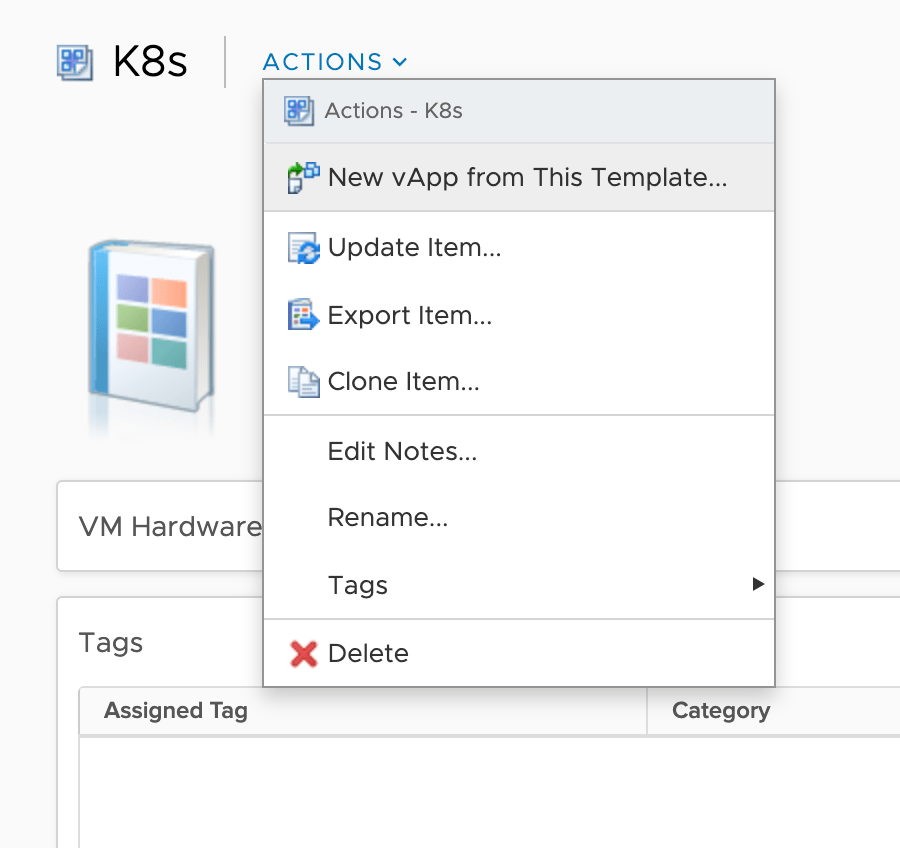
To get these three VMs up and running as quick as possible I built a vApp and stored it as a template in a vSphere content library:
Each of the VMs in this vApp template is pre-configured as follows:
Hostname
IP stack on the mgt NIC
Persistent storage directories
Python
Docker
Kubernetes (installed not initialized)
NSX Container Plug-in installation files
NSX Container Plug-in container image loaded to the local Docker repository
K8s cluster
Once the vApp is deployed the first thing I do is to initialize the K8s cluster:
k8s-master:~$ sudo kubeadm init
The two worker nodes are joined to the cluster. For example:
kubectl get nodes
NAME          STATUS     ROLES    AGE     VERSION
k8s-master    NotReady   master   2m26s   v1.16.4
k8s-worker1   NotReady            67s     v1.16.4
k8s-worker2   NotReady            15s     v1.16.4
Without a CNI plug-in installed the “NotReady” status is expected.
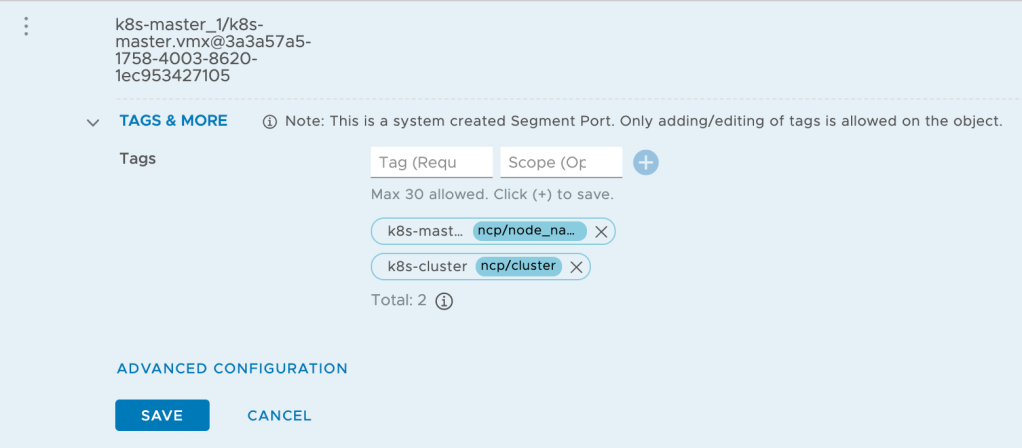
NSX container plug-in
Before installing NCP I need to tag the three segment ports of the “k8s-nodetransport” segment as follows:
Scope
Tag (k8s-master)
Tag (k8s-worker1)
Tag (k8s-worker2)
ncp/node_name
k8s-master
k8s-worker1
k8s-worker2
ncp/cluster
k8s-cluster
k8s-cluster
k8s-cluster
The ubuntu-ncp.yaml manifest that deploys NCP is already prepared for my lab environment. If you want to use it make sure you change the values for the following settings so that they match your environment:
nsx_api_managers
nsx_api_user
nsx_api_password
overlay_tz
tier0_gateway
The manifest is aligned with the JSON that I use to create the NSX-T components.
Installing the NSX container plugin from the master node by running:
kubectl apply -f ncp-ubuntu.yaml
After a minute or two the pods are running in their own “nsx-system” namespace:
The node status has changed to “Ready” now that NCP is installed:
NAME          STATUS   ROLES    AGE   VERSION
k8s-master    Ready    master   1h   v1.16.4
k8s-worker1   Ready             1h   v1.16.4
k8s-worker2   Ready             1h   v1.16.4
Step 5 – Deploy a workload
To have something to play around with I deploy a containerized WordPress in my K8s cluster. Here are the yaml files that I use to deploy WordPress in case you want to set this up yourself.
First I create a separate namespace for the workload:
kubectl create -f namespace.yaml
Next, I deploy WordPress in this namespace:
kubectl apply -k ./ -n wp
Running a “kubectl get pods -n wp” shows me something like this:
kubectl get pods -n wp
NAME                               READY   STATUS    RESTARTS   AGE
wordpress-55ddbf6d75-7zjc8         1/1     Running   1          109s
wordpress-mysql-78dddb6bf7-n8pvn   1/1     Running   0          109s
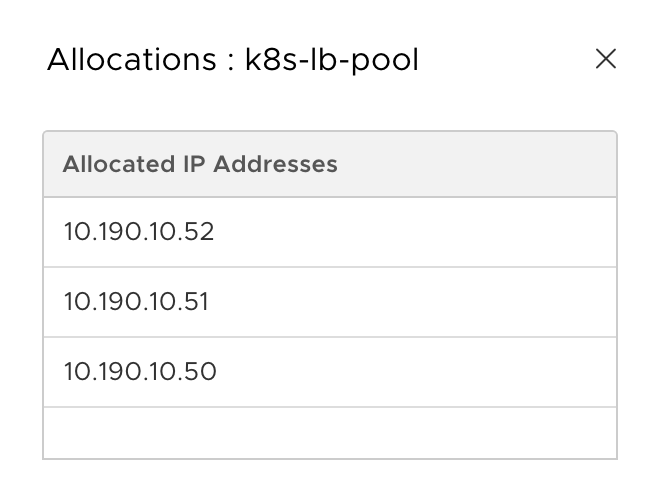
Running “kubectl get service -n wp” shows the external IP that is assigned by NSX-T from the “k8s-lb-pool”:
kubectl get service -n wp
 NAME              TYPE           CLUSTER-IP    EXTERNAL-IP    PORT(S)        AGE
 wordpress         LoadBalancer   10.101.4.78   10.190.10.51   80:30008/TCP   3m38s
 wordpress-mysql   ClusterIP      None                   3306/TCP       3m38s
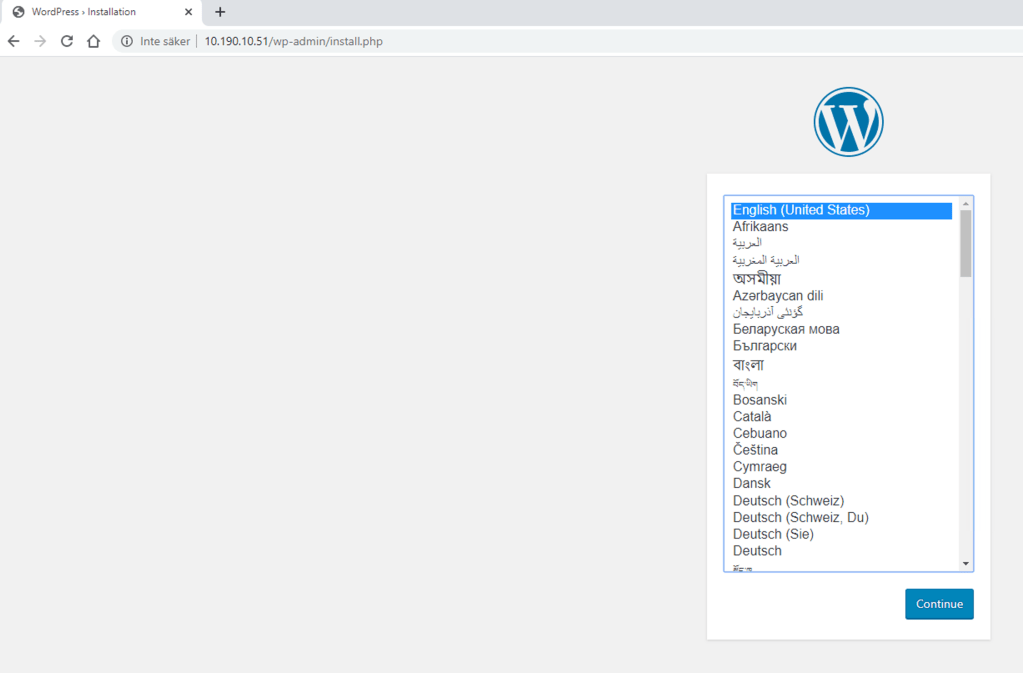
And browsing to “10.190.10.51” brings up a familiar page:
NSX-T container networking is operational. Happy blogging! 🙂
Summary
No rocket science here, but using the NSX-T hierarchical policy API is a time saver and so are vApp templates and yaml manifests. Put something like Ansible on top of this and you’re looking at a fully automated K8s with NSX-T deployment.
Hopefully this post inspires or maybe even helps you setting up your own NSX-T – K8s integration. It’s a pretty awesome solution and one I plan on covering in future posts as I learn more about it myself.
Like any other firewall the NSX-T Distributed Firewall (DFW) consumes memory and CPU. Unlike other firewalls the DFW’s resource consumption is distributed, taking place on the transport nodes where the workloads it protects reside.
Memory allocation
An ESXi transport node allocates a fixed amount of memory for the different DFW components. The amount of memory allocated depends on the total amount of RAM installed. For an ESXi host with 128GB RAM or more the allocation looks like this (NSX-T version 2.5):
DFW Component
Description
Memory Max Size (MB)
vsip-attr
Stores additional attributes used by the L7 context engine
1024
vsip-flow
Stores flow monitoring data
768
vsip-fqdn
Stores resolved FQDN addresses
512
vsip-module
Memory allocated to the vsip kernel process
2560
vsip-rules
Stores DFW rules, address sets and containers
3070
vsip-si
Memory allocated to the service insertion architecture
128
vsip-state
Stores DFW state (existing connections/connection table)
512
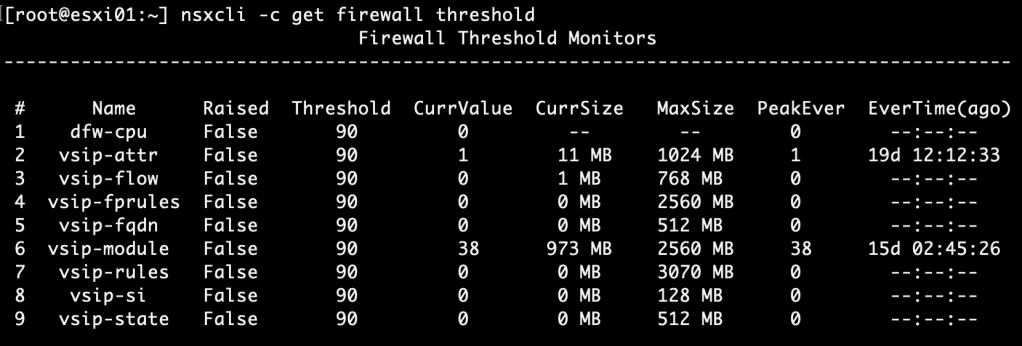
Thresholds
For both DFW memory and CPU usage the default threshold is set at 90%. You can see thresholds and current resource usage by running the “nsxcli -c get firewall thresholds” command on an ESXi transport node:
A similar command can be used from an NSX Manager node: “on <transport-node-id> exec get firewall thresholds“.
It’s nice that we can monitor the DFW resource usage on a per transport node basis, but in most environments this method isn’t very practical.
In today’s article I want to have a look at two things concerning DFW resource monitoring. Firstly, at how to configure custom thresholds for memory and CPU usage. Secondly, at how to set up central threshold monitoring with alerting.
Configuring custom DFW thresholds
Below are the steps at a high level for configuring custom DFW thresholds:
Create an NSGroup containing transport nodes
Create a threshold profile
Apply threshold profile
Verify
Time to get our hands dirty!
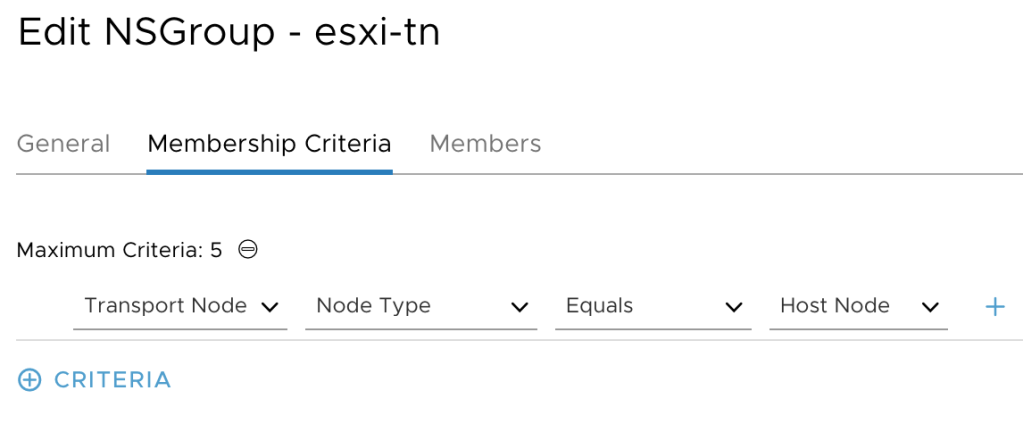
Step 1 – Create an NSGroup containing transport nodes
We need to group our transport nodes. Currently only NSGroups, the ones managed by the MP API, support having transport nodes as members.
NSGroups are managed under Advanced Networking & Security > Inventory > Groups. I’m creating an NSGroup called “esxi-tn” with a membership criteria that will add all the host transport nodes as members:
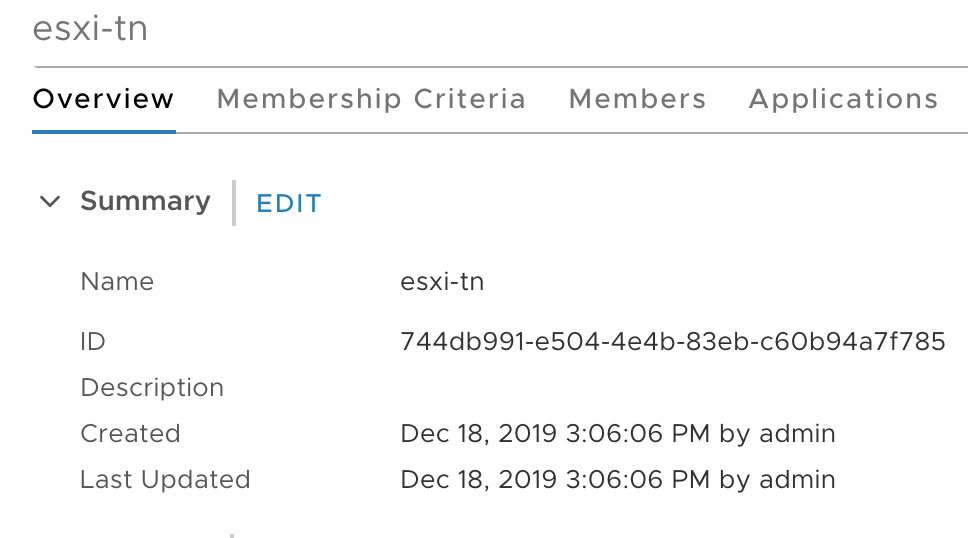
Copy the NSGroup ID to a text file as we need it at step 3:
Step 2 – Create a threshold profile
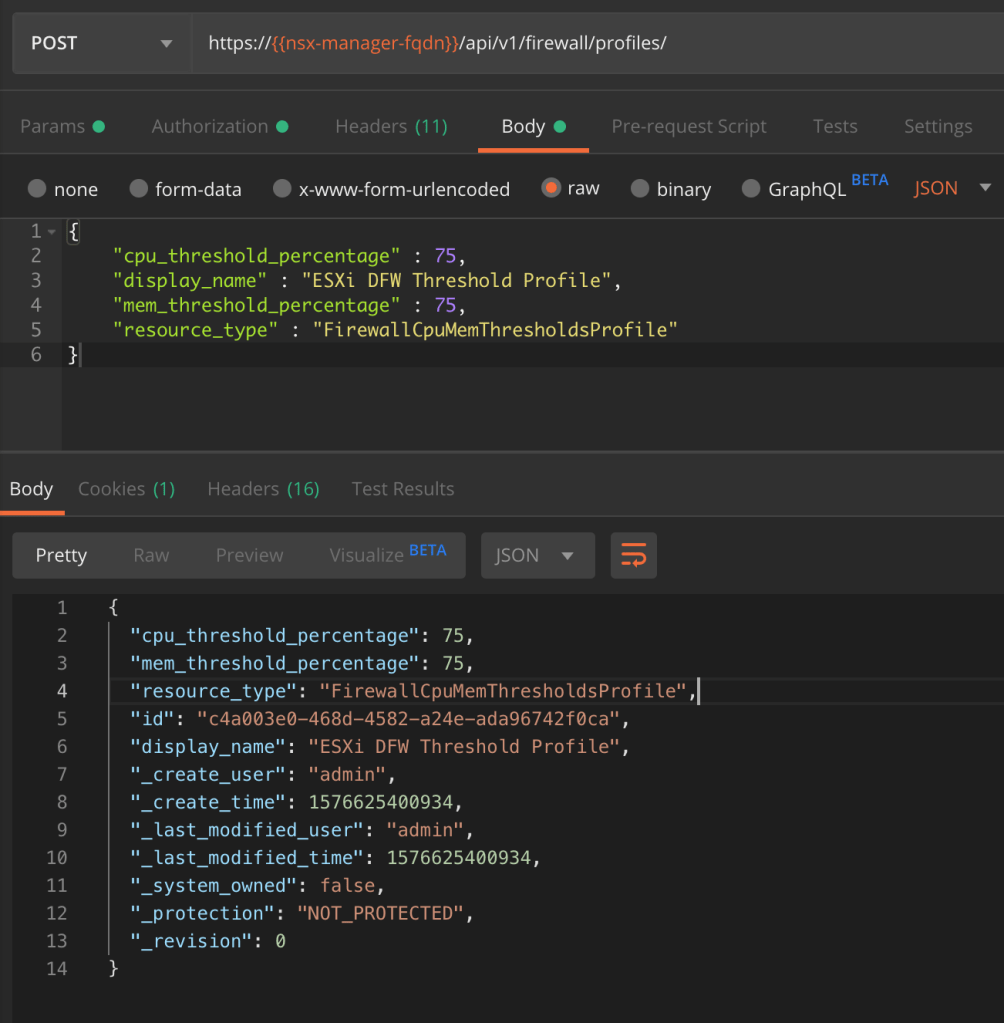
Using a REST API client we’re going to make a POST request to the NSX MP API:
POST https://{{nsx-manager-fqdn}}/api/v1/firewall/profiles
The request body contains the following piece of JSON code:
The values for “cpu_threshold_percentage” and “mem_threshold_percentage” will depend on your requirements. For this exercise I’m configuring a threshold at 75% for both memory and CPU usage.
The POST request body and the result:
Copy the threshold profile’s ID from the result to a text file as we need it in the next step.
Step 3 – Apply threshold profile
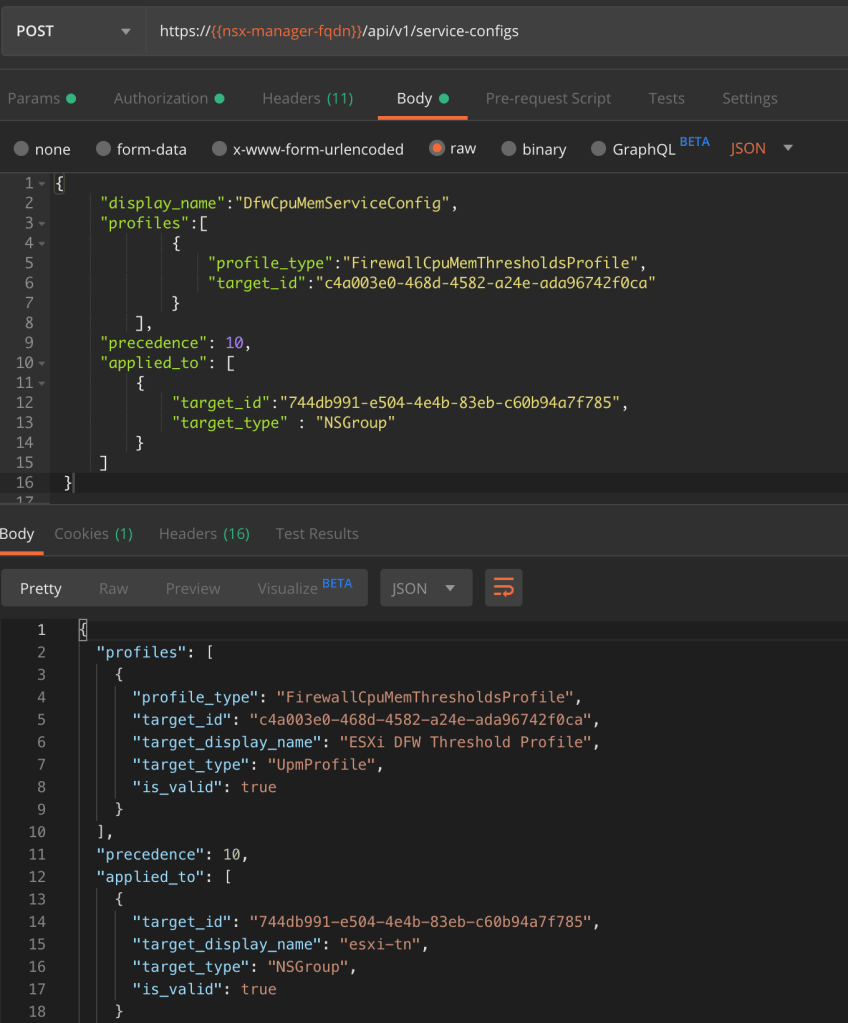
The second API call configures a service-config that links the threshold profile to the NSGroup:
POST https://{{nsx-manager-fqdn}}/api/v1/service-configs
The threshold profile and the NSGroup IDs that we copied to a text file earlier are used as the values for the two target_ids.
The POST request body and the result:
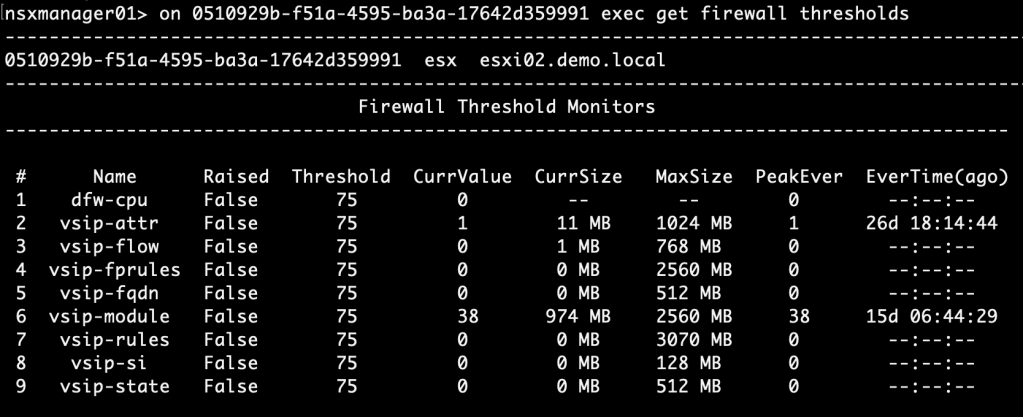
Step 4 – Verify
An easy way to verify that the new DFW thresholds have been applied is to run the “get firewall thresholds” NSXCLI command. This time I’ll run it from an NSX Manager node:
As we see the new threshold value of 75% has been applied.
Setting up alerting
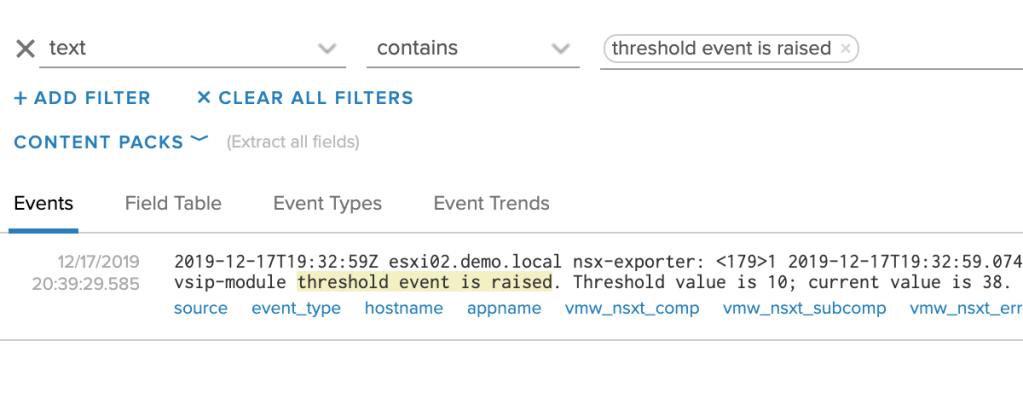
You might wonder what actually happens when a threshold is crossed? Currently there’s no alarming framework in NSX-T so the only thing that happens is that a threshold event is logged to syslog.
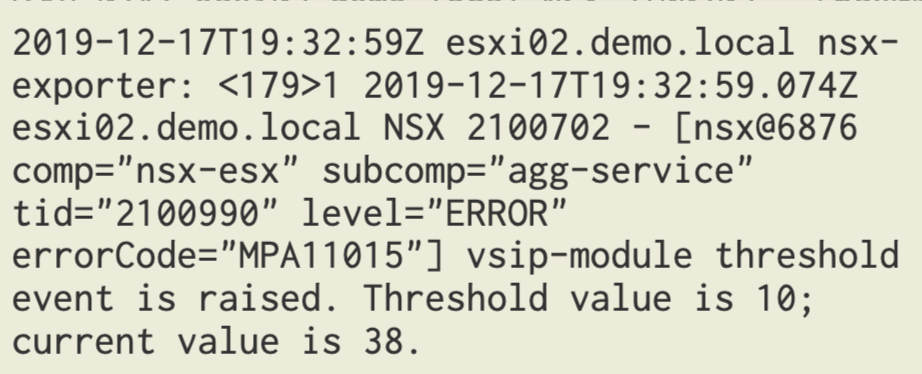
Luckily there’s always vRealize Log Insight. Configured as a syslog target for the NSX-T platform, DFW threshold events end up there too:
A quick look at a DFW threshold event. We see things like the transport node, the DFW component that crossed the threshold, as well as the configured threshold and the current usage.
Now that we know what a threshold event looks like, it’s easy to configure an alert based on the query in vRLI:
text contains “threshold event is raised”
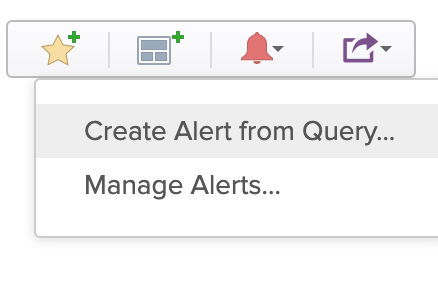
Click on “Create Alert from Query”:
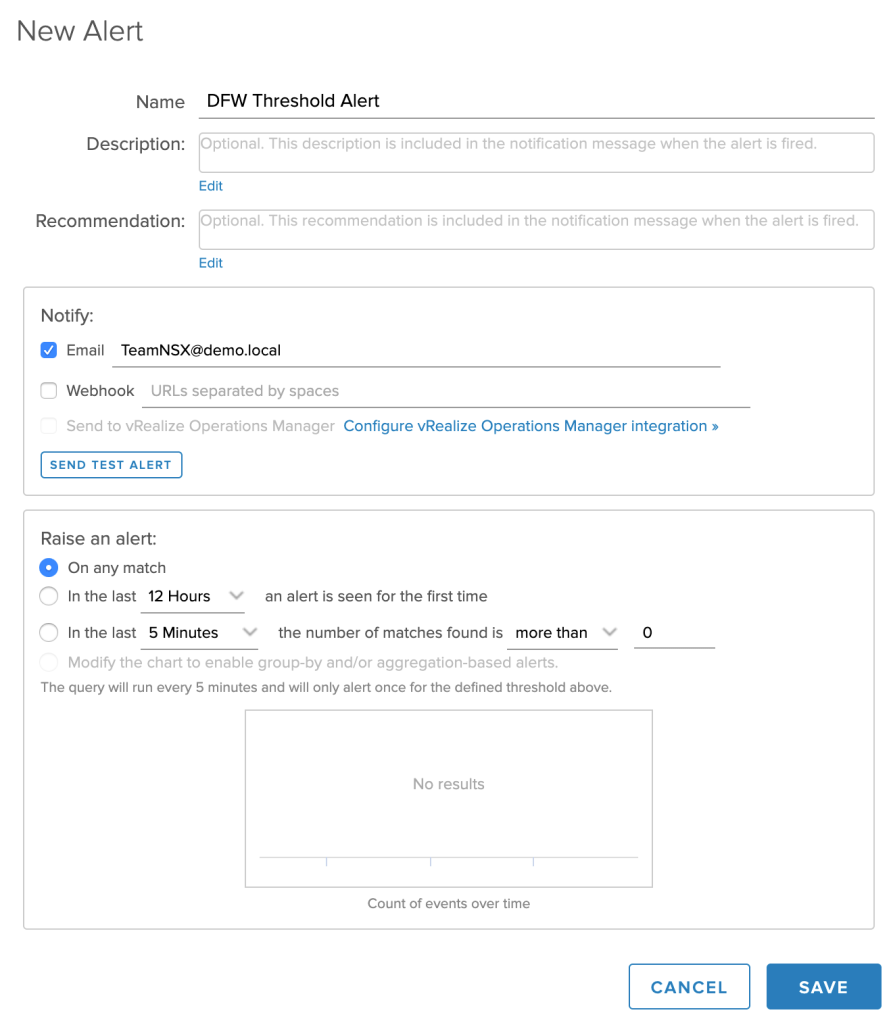
Fill out the details for the new alert:
And that’s it. From now on you’ll be notified each time a DFW threshold is crossed.
Summary
Configuring custom DFW thresholds and monitoring these with Log Insight isn’t too hard to set up. It’s true that with a proper DFW design and by sticking to good practices for implementation, problems related to DFW memory or CPU usage are rare. That being said, it’s not a bad idea to keep an eye on the DFW’s resource utilization. Just in case.
After receiving a couple questions about the NSX-T firewall policy locking feature, I decided to write a short blog post about it.
The purpose of locking a firewall policy
The easy part first. As explained in the official NSX-T documentation we lock a firewall policy to prevent multiple users from editing the same section.
Locks could be short term like when a team is working in the NSX Manager firewall UI at the same time and want to avoid configuration collisions. Locks could also be long(er) term. For example when somebody is tasked with building a more complex firewall ruleset or when policies are subject to change management.
Let’s start locking then!
Here’s where it can get a bit confusing. While the option to lock a policy is always available, it won’t have any effect until you implement and use Role Based Access Control (RBAC) for NSX-T management. Why?
The default “admin” account, which is the only account you can work with in the NSX Manager UI without RBAC, has the “Enterprise Admin” role assigned to it. This superuser role has permission to make changes to firewall policies even when they are locked.
So, if your team is using this default account (very bad practice) or individual accounts with the “Enterprise Admin” role assigned, you can lock firewall policies all you want, but these locks won’t have any actual effect.
Let’s fix this then!
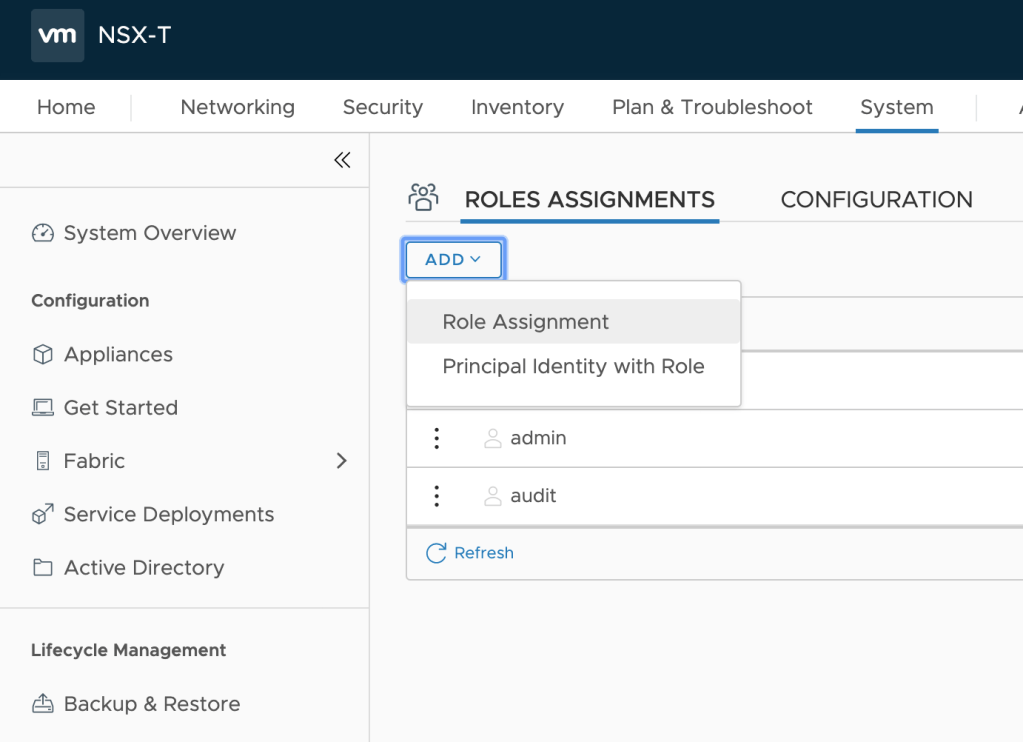
Yes. As said this requires that we implement and use RBAC for NSX-T management first. There’s documentation available that will help you set this up so I won’t go through that in this article. On a high level the process looks like this:
When that’s done we can start assigning NSX-T roles to Active Directory users:
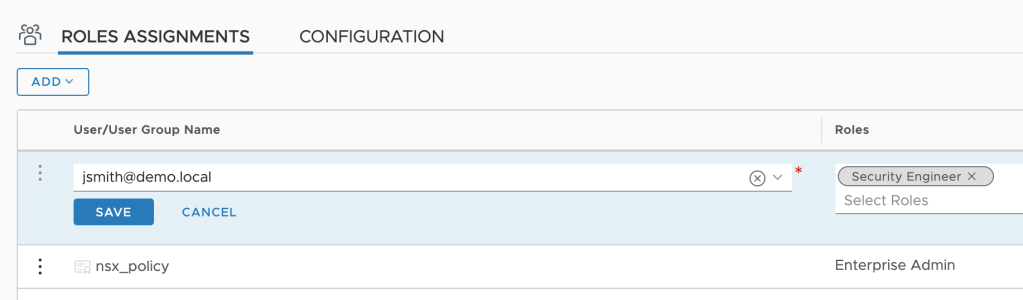
Example
In this example I’m assigning the “Security Engineer” role to two AD users:
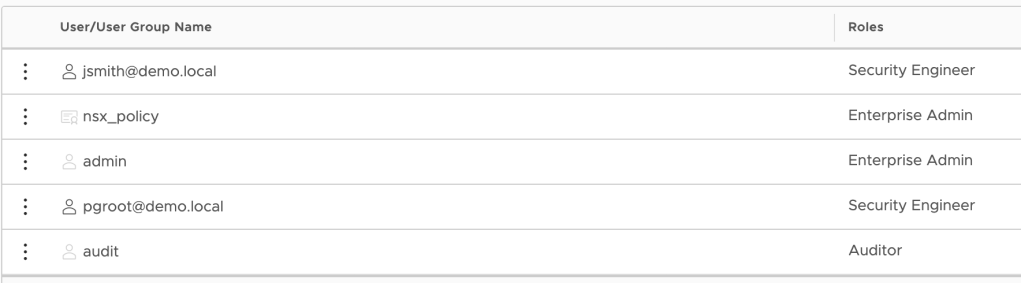
The two security engineers have been configured:
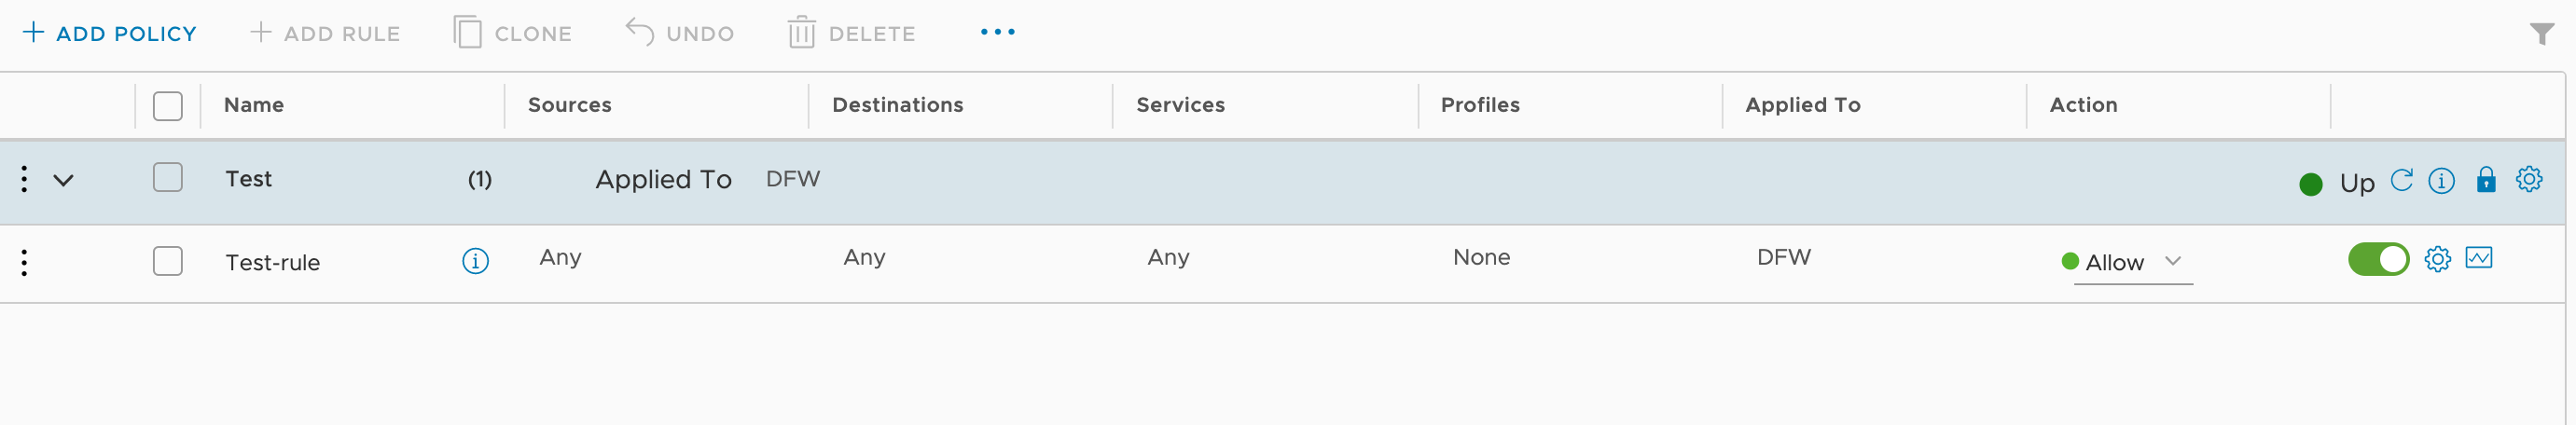
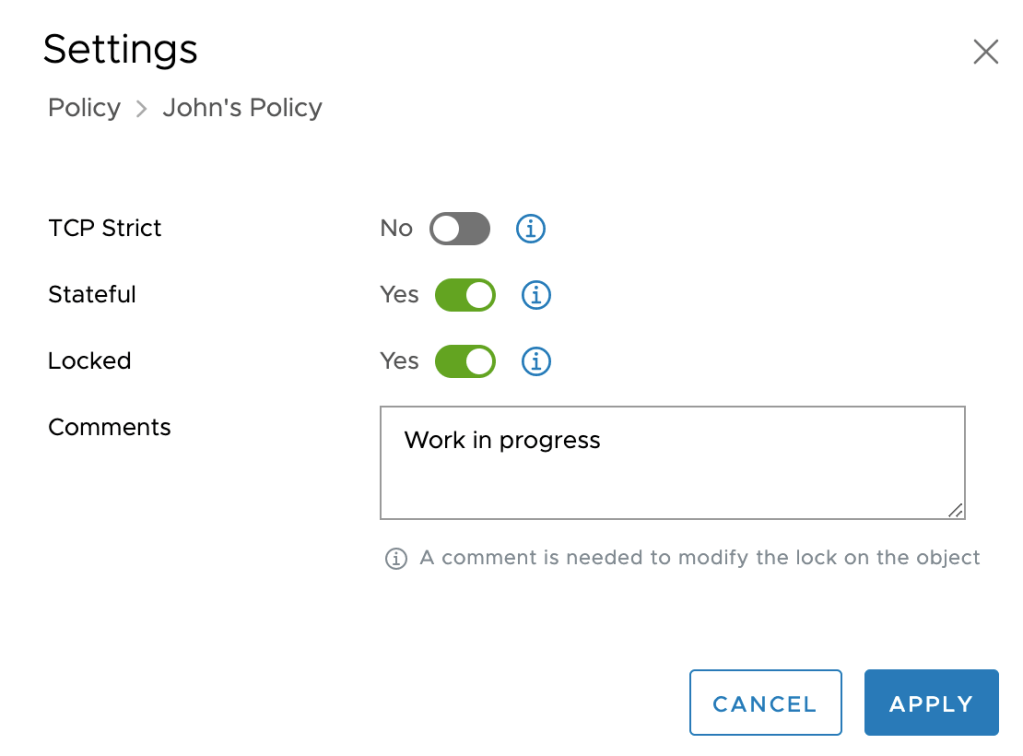
Let’s pretend “jsmith@demo.local” logs in to the NSX Manager UI and starts working on a new DFW policy:
When called into a meeting jsmith locks the policy he’s working on to prevent anybody from making changes:
Next, the other security engineer “pgroot@demo.local” logs in to the NSX Manager UI. She has a look at the new policy and decides to make a minor change to it. When she tries to publish the change the following message appears:
The change can’t be realized with her account. This is the expected and desired behaviour. The policy lock is enforced with RBAC implemented.
Summary
While most organizations have the RBAC components for NSX-T management in place (vIDM, AD, etc), actually leveraging NSX-T management roles so that things like locking firewall policies work is perhaps another thing. Hopefully this short article gave you some better understanding of how to get started.
With every new release of NSX-T interesting features are added to the platform. Take failure domain for example.
Introduced in version 2.5, failure domain adds another layer of protection for the centralized services running on Tier-1 Gateways. It basically facilitates a rack aware placement mechanism for the Tier-1 service router (SR) components.
In today’s article I’m going to do a simple failure domain proof of concept. I’ll walk through the configuration steps for setting up failure domain and verify its functionality.
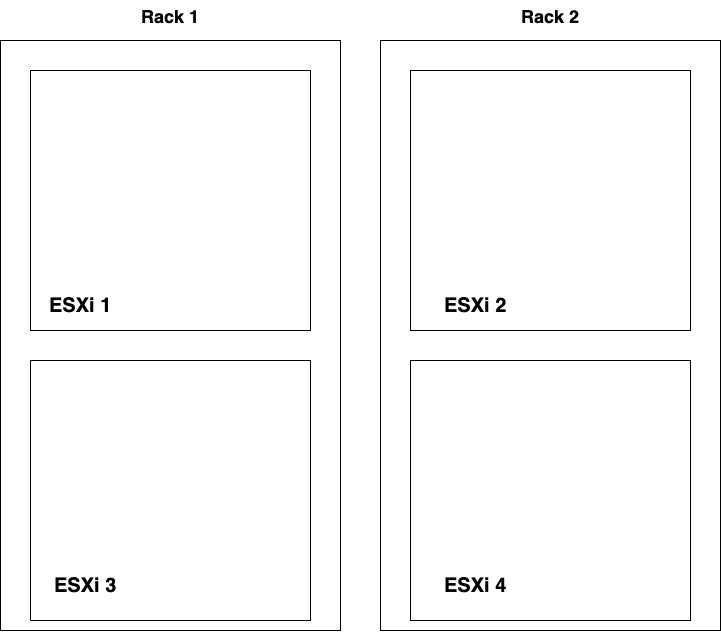
The lab environment
For this exercise I installed a vSphere cluster consisting of four ESXi hosts divided over two racks. I’m calling these the Edge racks and made this very advanced diagram:
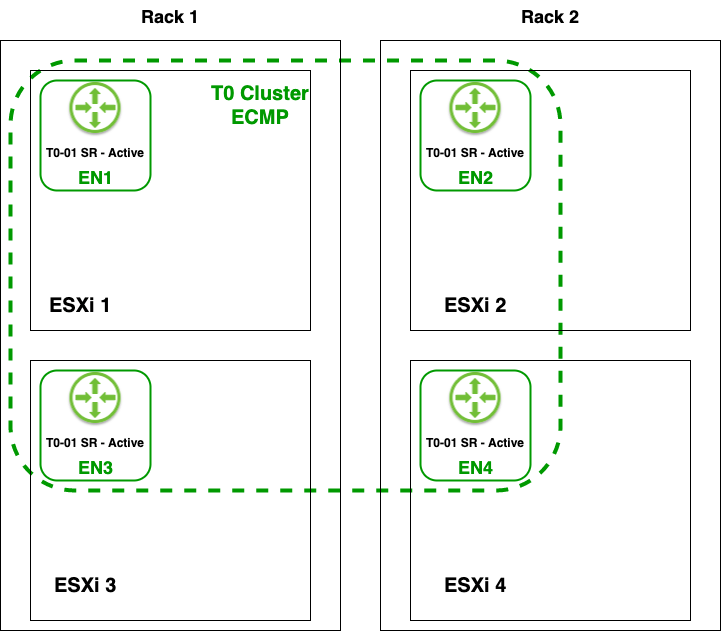
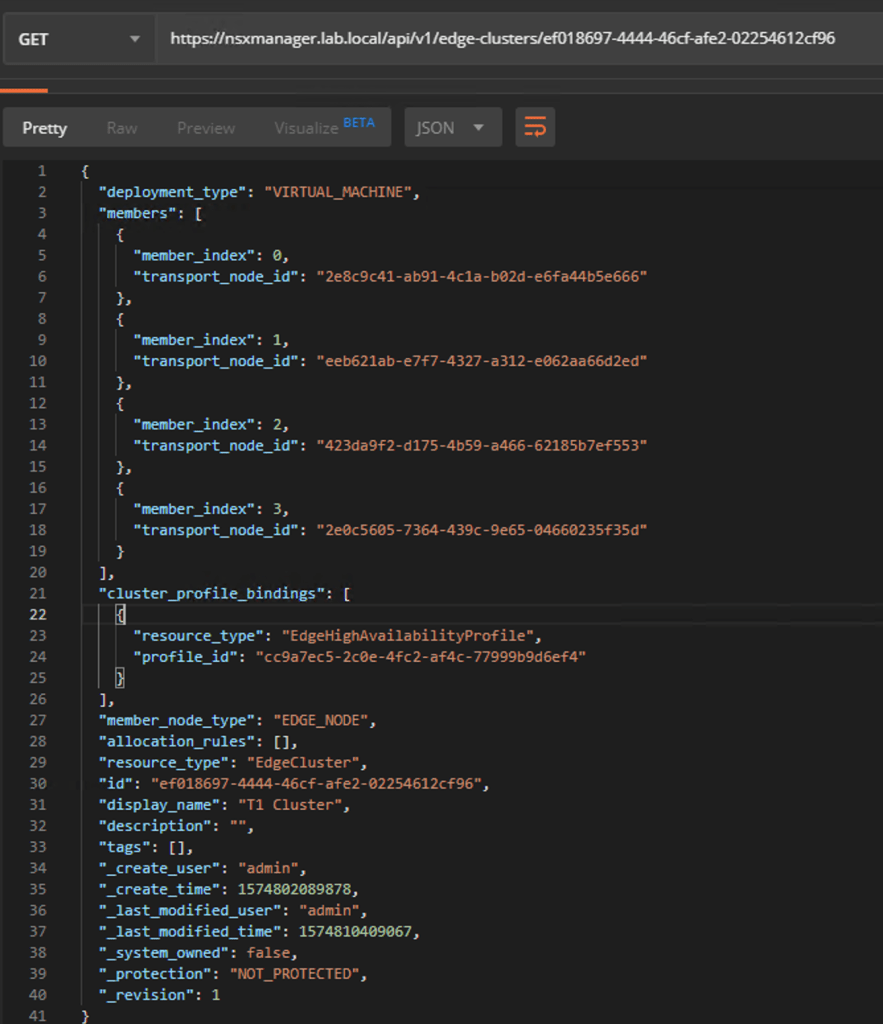
I then deployed four NSX-T Edge nodes (EN1 – EN4), one on each host, and added these to NSX-T Edge Cluster “T0 Cluster ECMP”:
I threw in a Tier-0 Gateway called “T0-01” which is running in Active-Active HA mode with ECMP enabled. The Tier-0’s 8 uplinks are all taking part in forwarding North-South traffic, simultaneously:
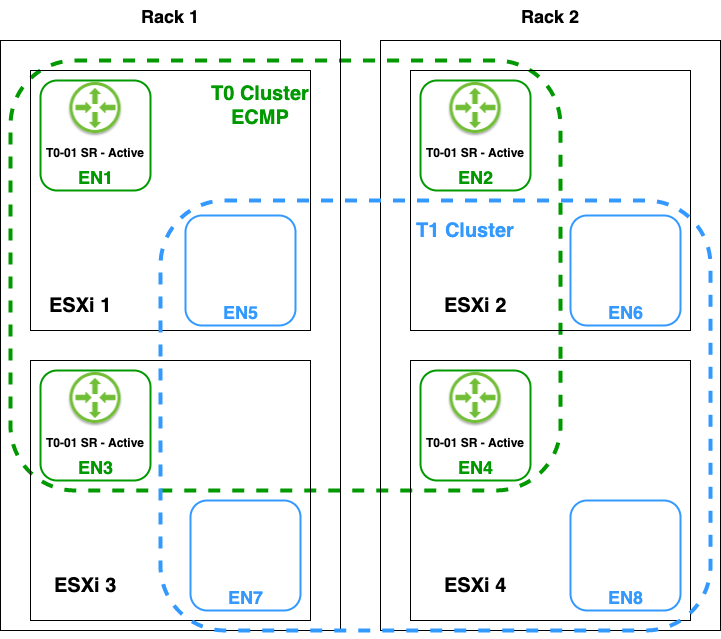
Finally, I deployed four more Edge nodes (EN5 – EN8), one on each host, and added these to Edge cluster “T1 Cluster”:
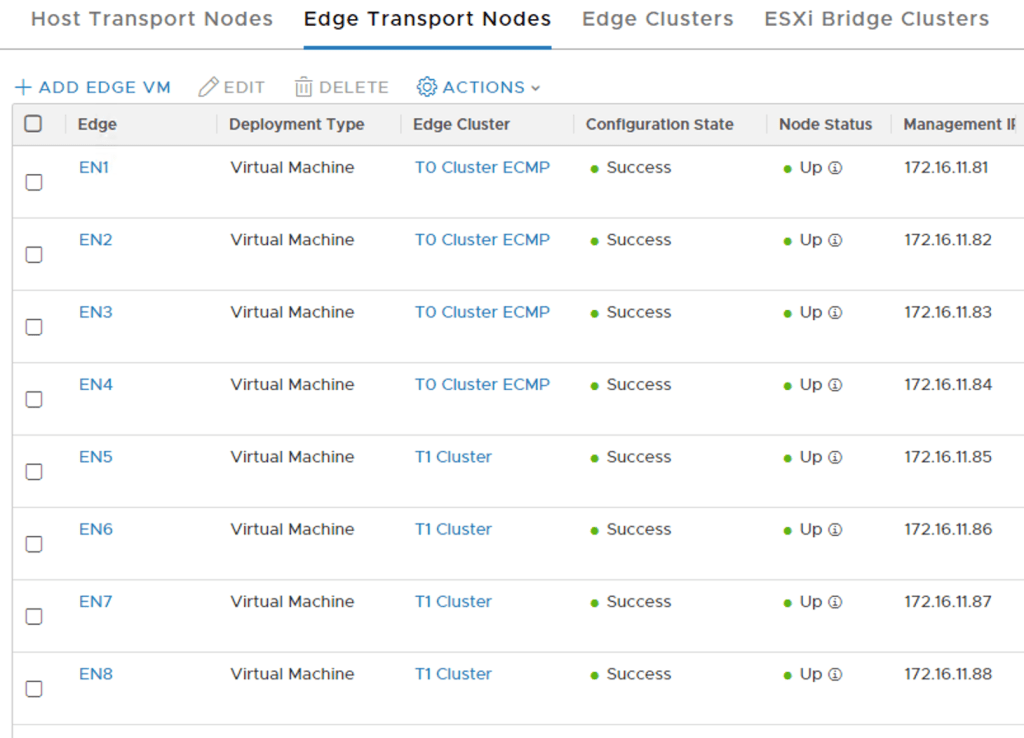
The eight Edge nodes in the NSX Manager UI:
Next step – Create Tier-1s
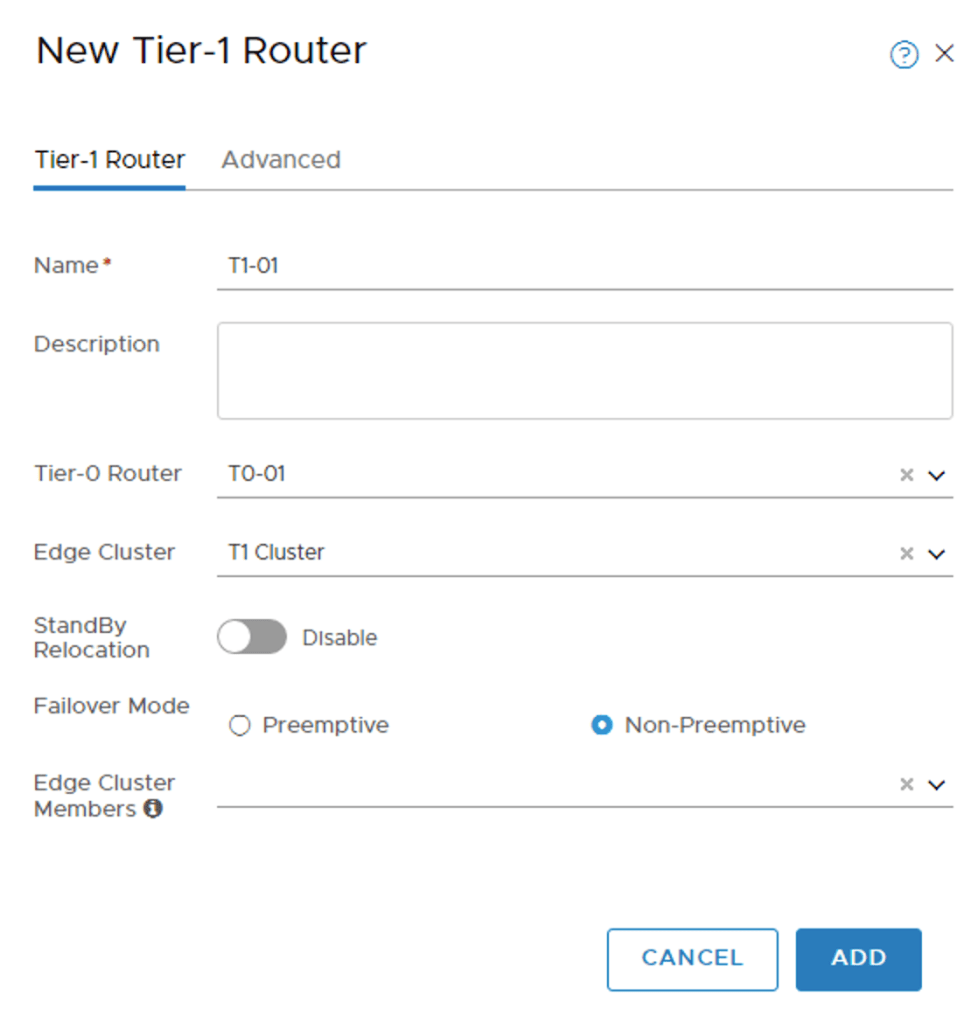
I will create Tier-1 Routers (Manager API) as opposed to Tier-1 Gateways (Policy API). This because the API call to trigger a Tier-1 SR reallocate I want to run later on only works on Tier-1 Routers. This has nothing to do with the failure domain feature itself which is compatible with both Tier-1 Routers and Tier-1 Gateways of course.
Configuring the first Tier-1 called “T1-01”:
I’m selecting the “T1 Cluster” Edge Cluster and no specific Edge Cluster Members.
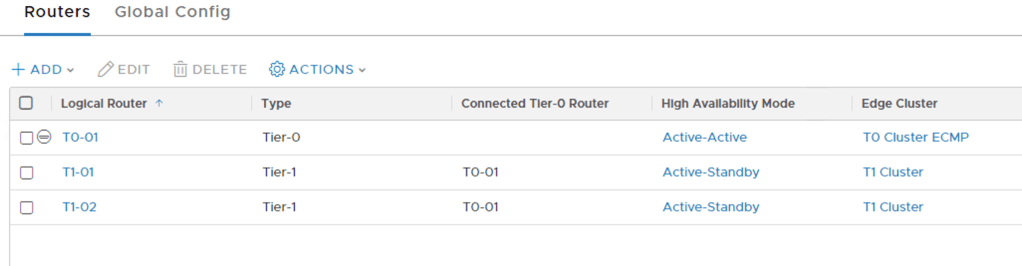
Both of the Tier-1s and the Tier-0 listed in the NSX Manager UI:
Tier-1 service routers
Selecting an Edge cluster for a Tier-1 indicates that you intend to run one or more centralized services on that Tier-1. This means that one active and one standby service router (SR) are instantiated on two different Edge nodes in that cluster (a Tier-1 SR always runs in Active-Standby HA mode).
By the way, you should not select an Edge Cluster for a Tier-1 if you don’t intend to run centralized services on it as this can lead to unintended hairpinning of traffic over the Edge nodes.
You noticed that I didn’t specify any Edge Cluster Members for the SRs. This results in the management plane picking them for me. So where did they end up?
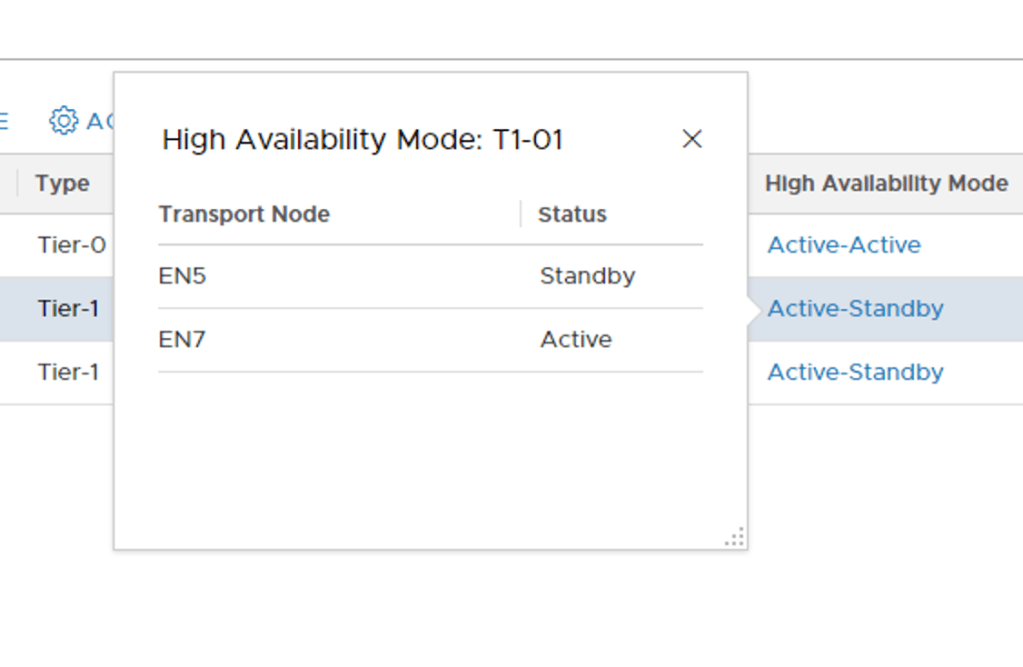
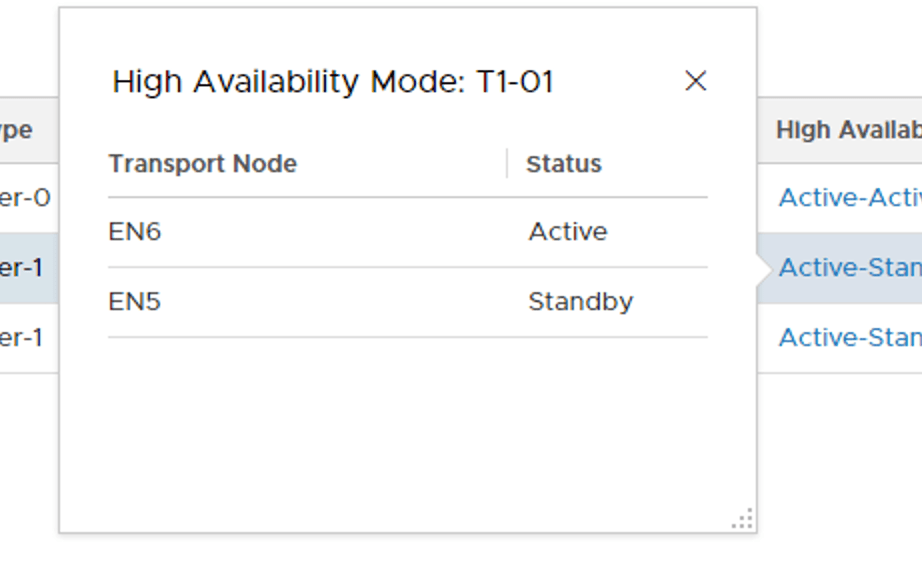
Clicking the Active-Standby link for each of the Tier-1 Routers reveals the SRs location. “T1-01” has its active SR on Edge node EN7 and its standby SR on Edge node EN5:
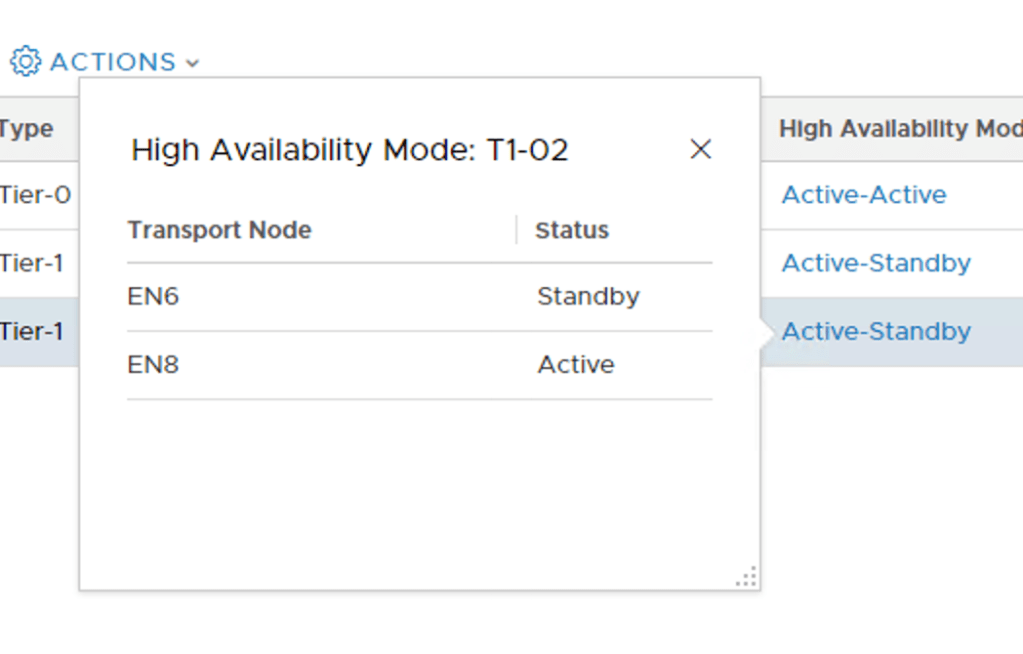
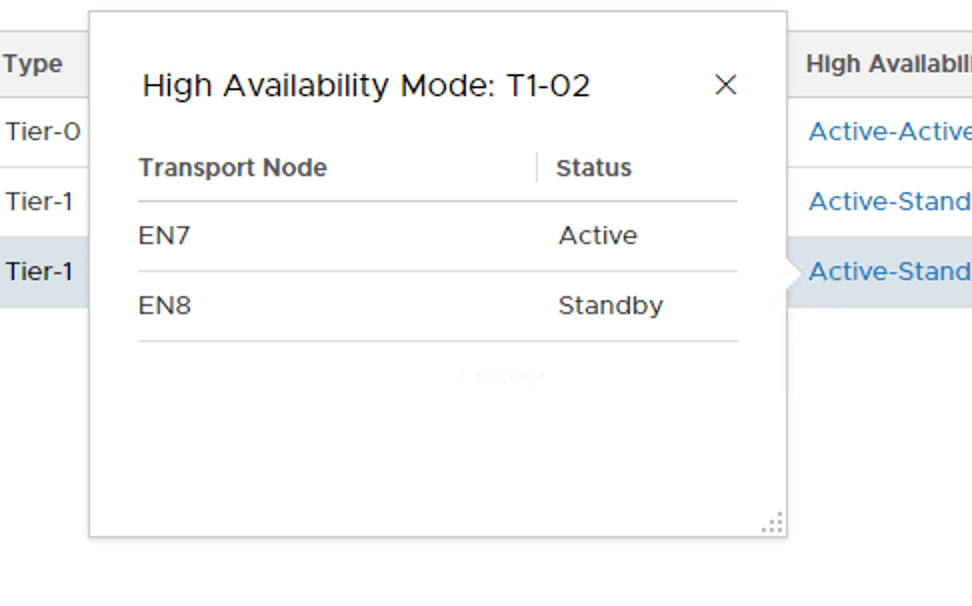
“T1-02” has its active SR on Edge node EN8 and its standby SR on Edge node EN6:
Fine. Let’s have a look at the Edge rack again now that we have introduced these Tier-1 SRs to the environment:
My two Tier-1s are in separate racks. Great! Or is it? With the current Tier-1 SR placement a single Edge rack failure will result in one of the Tier-1 Routers losing both its active and the standby SR. That’s pretty bad.
Failure Domain
Failure domain prevents this silly SR placement from happening. Correctly configured, failure domain ensures that the active and standby SRs of a Tier-1 are always placed in different racks.
Sounds great. Time set this up.
Step 1 – Create two failure domains
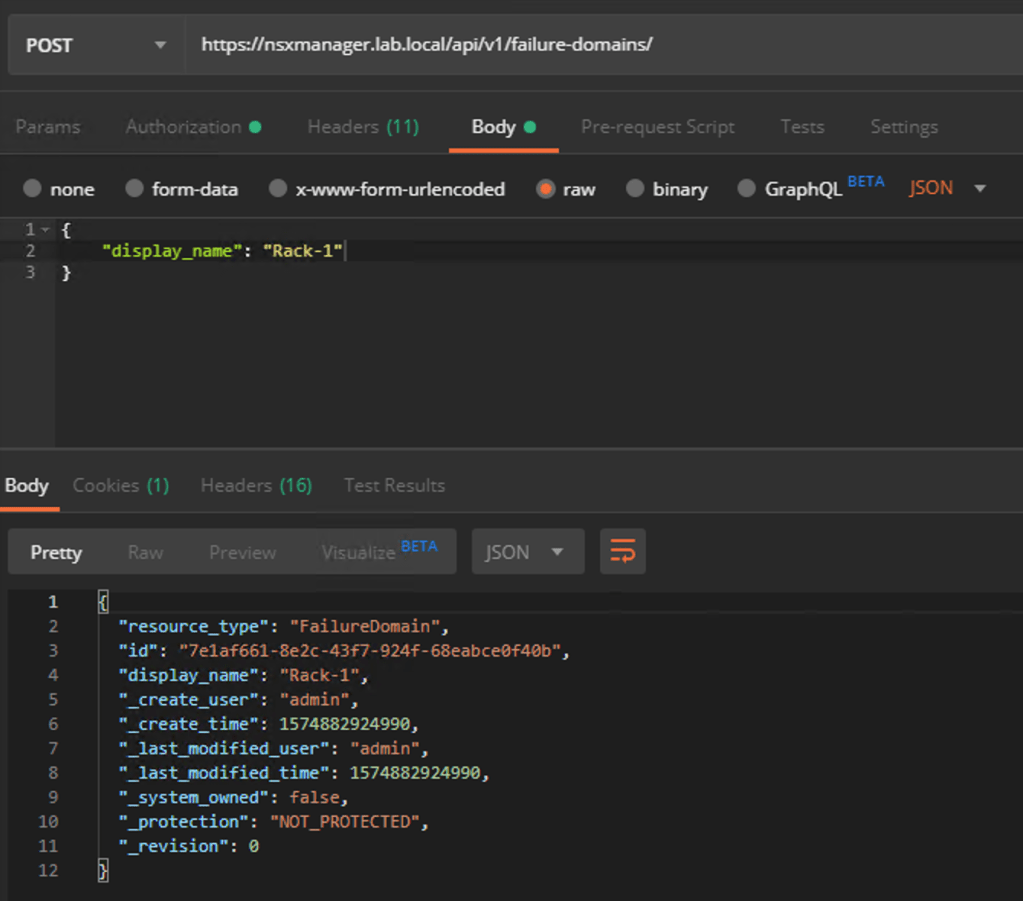
Failure domains are created using a POST request to the NSX API at:
POST https://{{nsx-manager-fqdn}}/api/v1/failure-domains/
The request body for my first failure domain contains the following piece of JSON code:
{
"display_name": "Rack-1"
}
The JSON code for my second failure domain:
{
"display_name": "Rack-2"
}
Creating the first failure domain using Postman:
Copy the value for “id” from the request result for each of the failure domains as we need these in the next step.
Step 2 – Assign Edge nodes to failure domains
The Edge nodes in the “T1 Cluster” need to be assigned to their respective failure domains. This too is done through an API call to the Manager API.
For each Edge node we first retrieve its current configuration using the following GET request:
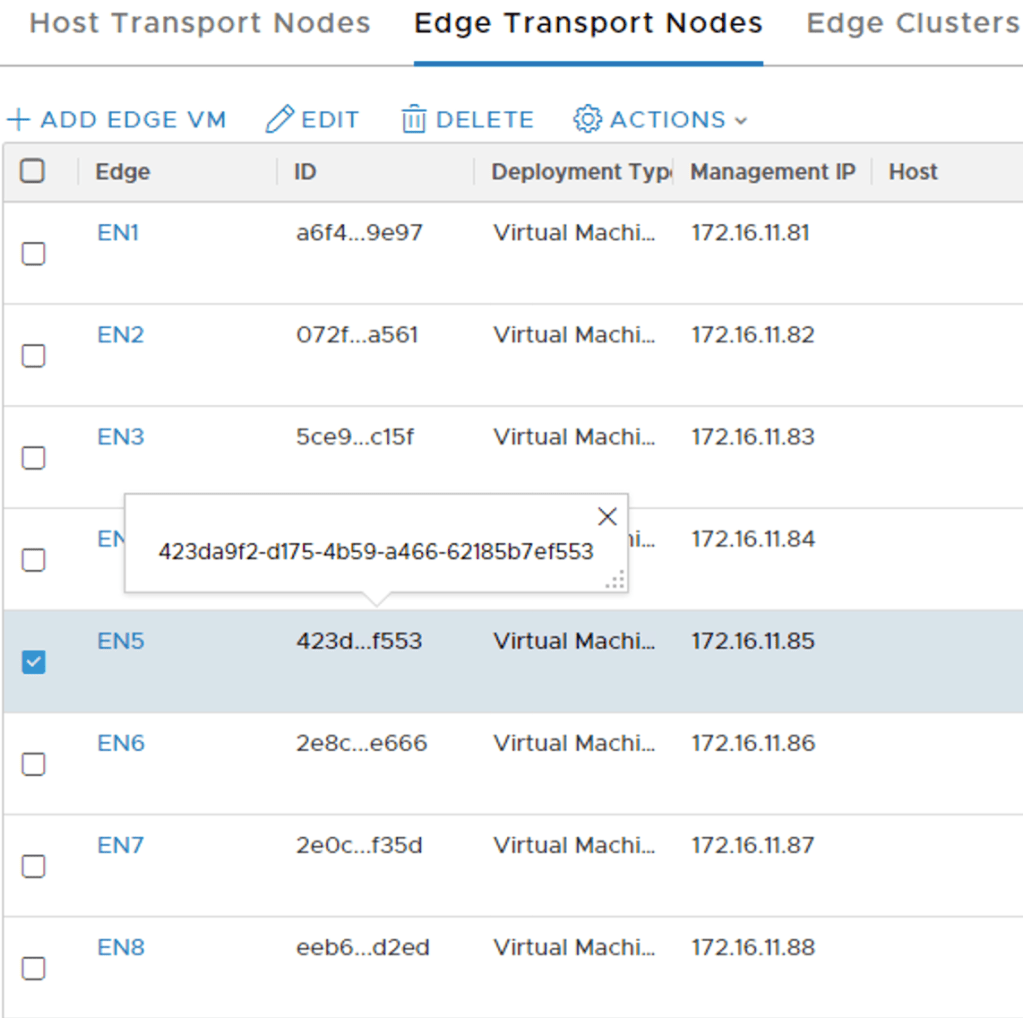
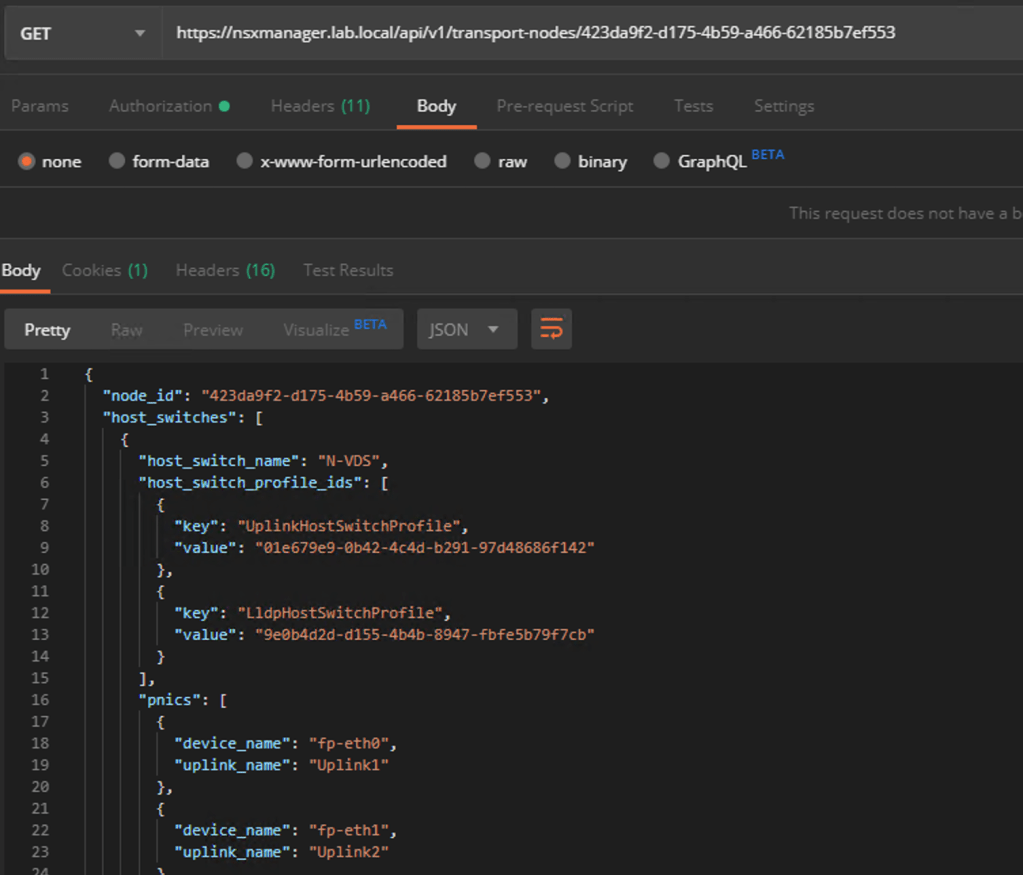
GET https://{{nsx-manager-fqdn}}/api/v1/transport-nodes/{{edge-node-id}}
You can find the ID of an Edge node in the NSX Manager UI (or via API):
The GET request for Edge node EN5:
Copy the request result to the body of a new PUT request and change the value for “failure_domain_id” to match the ID of one of the newly created failure domains.
PUT https://{{nsx-manager-fqdn}}/api/v1/transport-nodes/{{edge-node-id}}
Which failure domain ID to use depends on the rack location of the Edge node. The following table lists the failure domain plan for my Tier-1 Edge nodes:
Edge Node
Failure Domain
Failure Domain ID
EN5
Rack-1
7e1af661-8e2c-43f7-924f-68eabce0f40b
EN6
Rack-2
d78707df-2f7f-48a9-9e3e-98a5523901c7
EN7
Rack-1
7e1af661-8e2c-43f7-924f-68eabce0f40b
EN8
Rack-2
d78707df-2f7f-48a9-9e3e-98a5523901c7
Four GET/PUT requests later the Edge nodes have been assigned to the correct failure domains.
Step 3 – Configure the Edge Cluster
The “T1 Cluster” Edge Cluster needs to be configured for failure domain based placement. This is also done via the API.
First a GET request to retrieve the current configuration of the Edge Cluster:
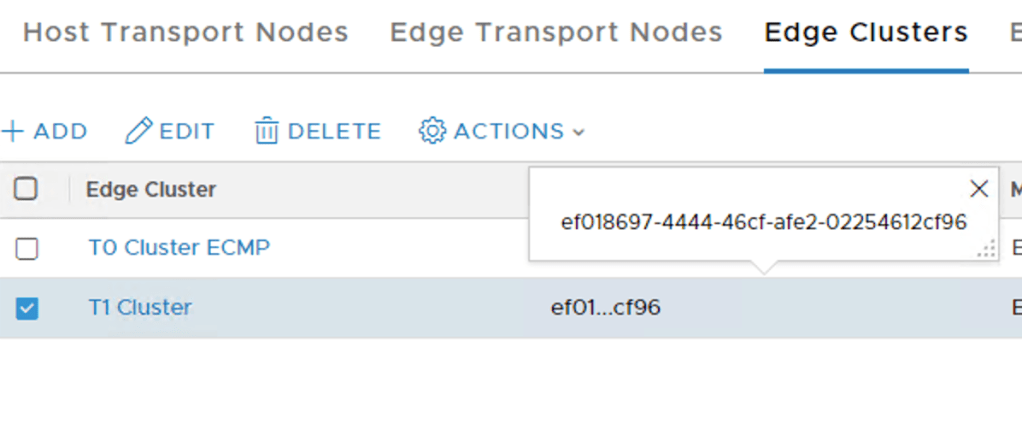
GET https://{{nsx-manager-fqdn}}/api/v1/edge-clusters/{{edge-cluster-id}}
The “edge-cluster-id” can be found in the NSX Manager UI (or via API):
The GET request’s result in JSON:
Again, you copy the request result to the body of a new PUT request. The only thing that we need to change here is the value for “allocation_rules”
PUT https://{{nsx-manager-fqdn}}/api/v1/edge-clusters/{{edge-cluster-id}}
And we’re done. From now on this Edge Cluster will perform failure domain based placement for new Tier-1 SRs.
A new Tier-1
Let’s put this to the test immediately by creating a new Tier-1.
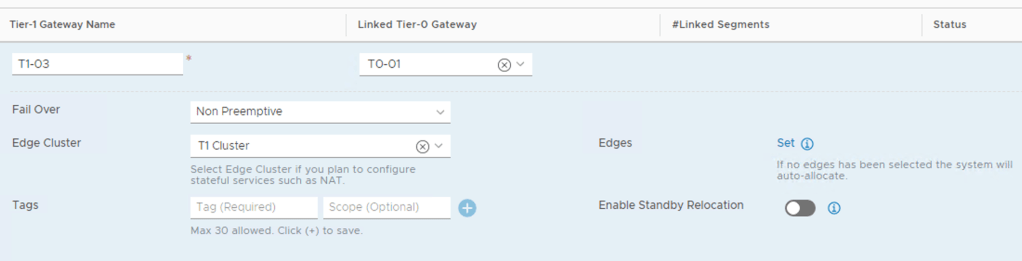
Here comes “T1-03”:
Once again I’m selecting the “T1 Cluster” Edge cluster and no specific Edge nodes (= Auto Allocated). So where did the management plane decide to place the SRs this time?
The Active SR is on EN5 and the standby SR on EN6. They indeed ended up in separate racks!
Existing Tier-1s
What about the Tier-1 SRs that were deployed before we configured failure domains? Can we trigger a reallocation so that they too are placed in accordance to the new failure domain configuration?
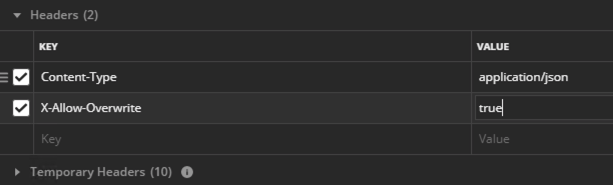
It turns out that we can, but it’s a data plane disruptive operation and, as far as I know, only works for Tier-1s created through the manager API (or in the UI under Advanced Networking & Security). Thank you Gary Hills for letting us know that the reallocate API call works for Tier-1s created in Policy UI/API as well by adding a header to the below request with key “X-Allow-Overwrite” and value of “true”:
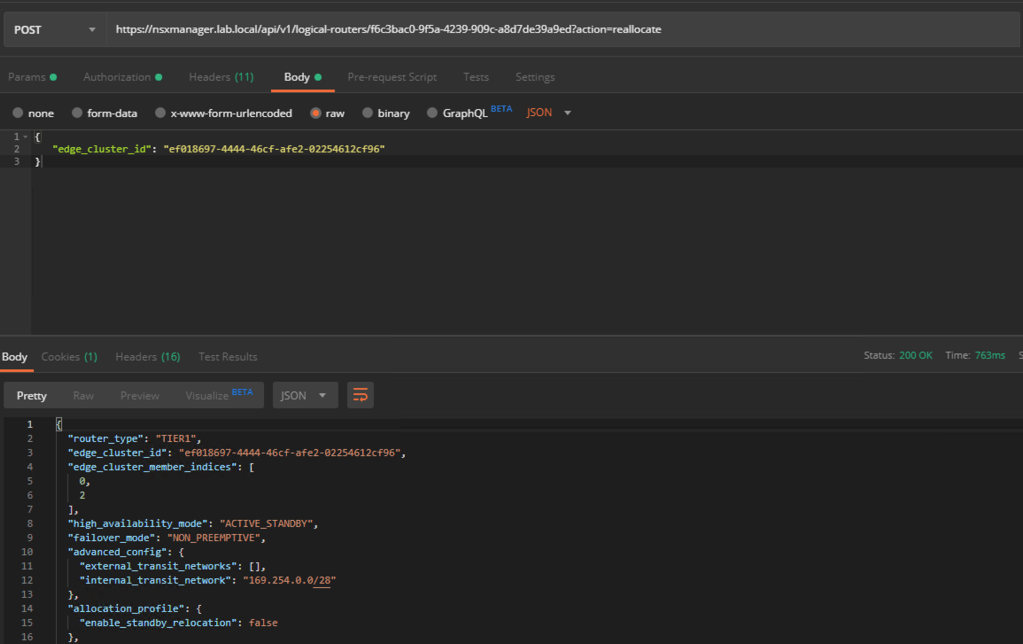
A POST request on each of the existing Tier-1s will do the trick:
POST https://{{nsx-manager-fqdn}}/api/v1/logical-routers/{{logical-router-id}}?action=reallocate
The request body should contain the following JSON:
{
   "edge_cluster_id": "{{edge-cluster-id}}"
}
The values for “logical-router-id” and “edge-cluster-id” can be found in the NSX Manager UI (or via API).
Request accepted by the API:
A reallocation process now takes places behind the scenes. A few moments later we see that the active and standby SRs of the existing Tier-1s are now in separate racks:
Let’s have a last look at the Edge rack after implementation and enforcement of the failure domains:
Looks so much better now!
Summary
Today we had a look at how to set up Tier-1 failure domain in NSX-T 2.5. The goal was to ensure that active and standby Tier-1 SRs ended up in separate racks.
Failure domain is a pretty cool and useful new feature adding extra protection for the Tier-1 SRs. Currently configurable via the API only, but that process was straight forward. With just a couple of request we got failure domains up and running.
Whether Tier-1 failure domain makes sense in your environment will depend on your NSX Edge design, number of Edge nodes, and things like future growth.
Imagine this, you’ve been tasked with implementing micro-segmentation in your vSphere environment. You just deployed and configured NSX-T and the next step is to migrate VMs from their VDS port groups to N-VDS segments.
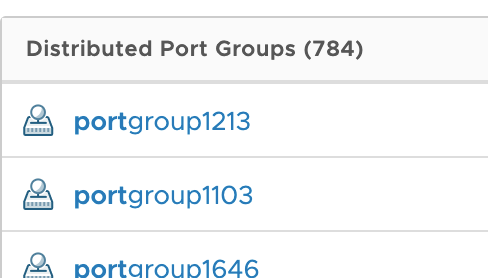
You fire up the vSphere Client and expand the VDS to have a look at the current situation:
It’s pretty bad.
Turns out your VMs are connected to no less than 784 different port groups! Overlay networking/consolidation and re-IP are currently not part of the plan so you’re stuck with these 784 VLANs. You now realize that you need to create 784 VLAN backed segments in NSX-T. Life sucks.
Postman to the rescue
In today’s short post I want to share an easy way that can help you out in a scenario like the one above. It involves the NSX-T Policy API, Postman, and a text file. Let’s go!
Step 1 – Prepare the CSV file
First we need to create a simple text file that contains values for the NSX-T segments and their corresponding VLAN IDs. The format of the comma separated text file is as follows:
As you can see the variables “{{segment_name}}” and “{{vlan_id}}” are used a couple of times in this piece of code. Their values will be fetched from the matching columns in the ”segments.csv”.
The value for “transport_zone_path” is unique in every NSX-T deployment. You can easily find the ID of your VLAN transport zone in the NSX Manager UI under System > Configuration > Fabric > Transport Zones:
Putting it all together the Postman request will look like this:
I’m saving this request as “Create NSX-T Segments with data file” in a new collection folder called “NSX-T”.
Step 3 – Start the Postman Runner
Click the Runner button to start the collection runner:
In the next screen you select the saved request:
We need to configure a couple of things for this run. The table below lists my settings:
Setting
Value
Comment
Environment
Your NSX-T environment
Have a look at this post for more information about working with Postman environments.
Iterations
784
We have 784 segments in our data file.
Data
segments.csv
The data file.
After selecting your data file you can click the Preview button just to verify that Postman is interpreting the data correctly:
Looks pretty good to me. Time to press the big button:
Running these 784 iterations will take a couple of minutes. You can monitor the progress in the “Run Results” screen:
Notice the “200 OK” status for each iteration which is the NSX-T API’s response to the requests and means it was processed successfully.
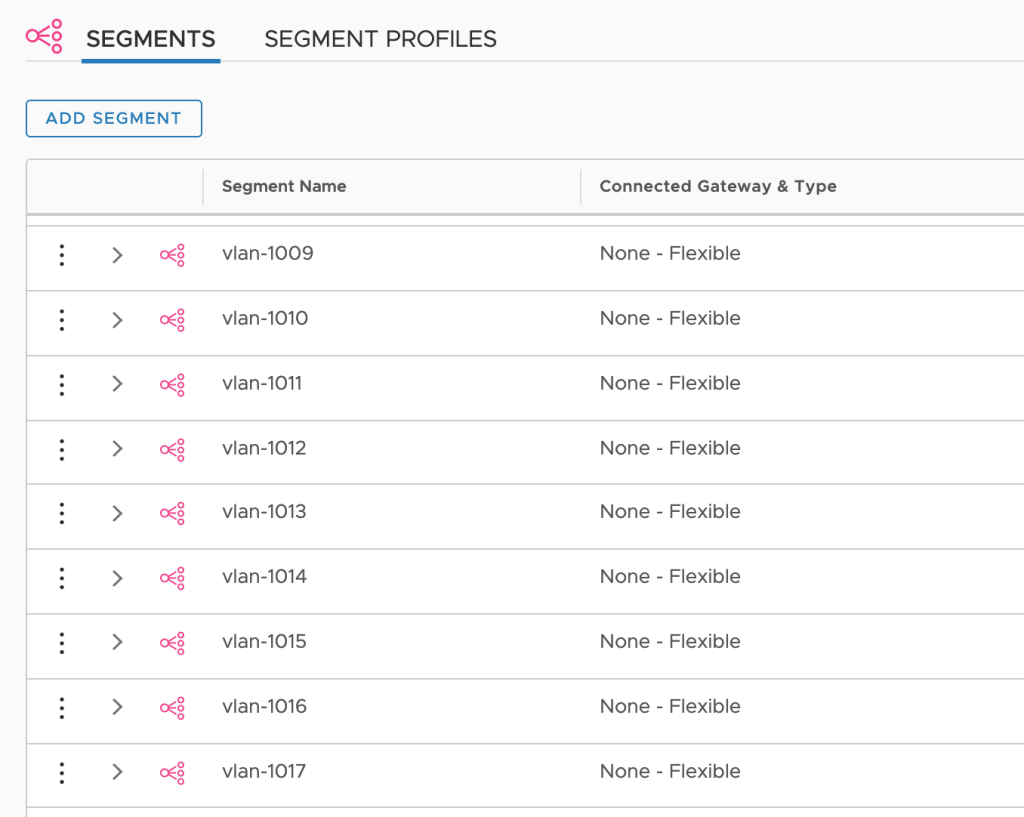
Once the Runner is finished it’s time to have a look in the NSX Manager UI under Networking > Connectivity > Segments to see if new segments have been created:
That certainly seems to be the case. All of the 784 VLAN backed segments are there and configured with the correct transport zone and VLAN ID:
Summary
Bulk creating or modifying NSX-T objects can be done in a number of different ways. If coding is your thing you’ll probably have little trouble putting together a tool for this using your preferred language. If you’re more into scripting you can use something like PowerShell. And if you like to work really slow you can always turn to the NSX Manager UI.
For everybody else there’s Postman. Using this tool in combination with data files offers an easy and quick way for creating or modifying large amounts of NSX-T objects.
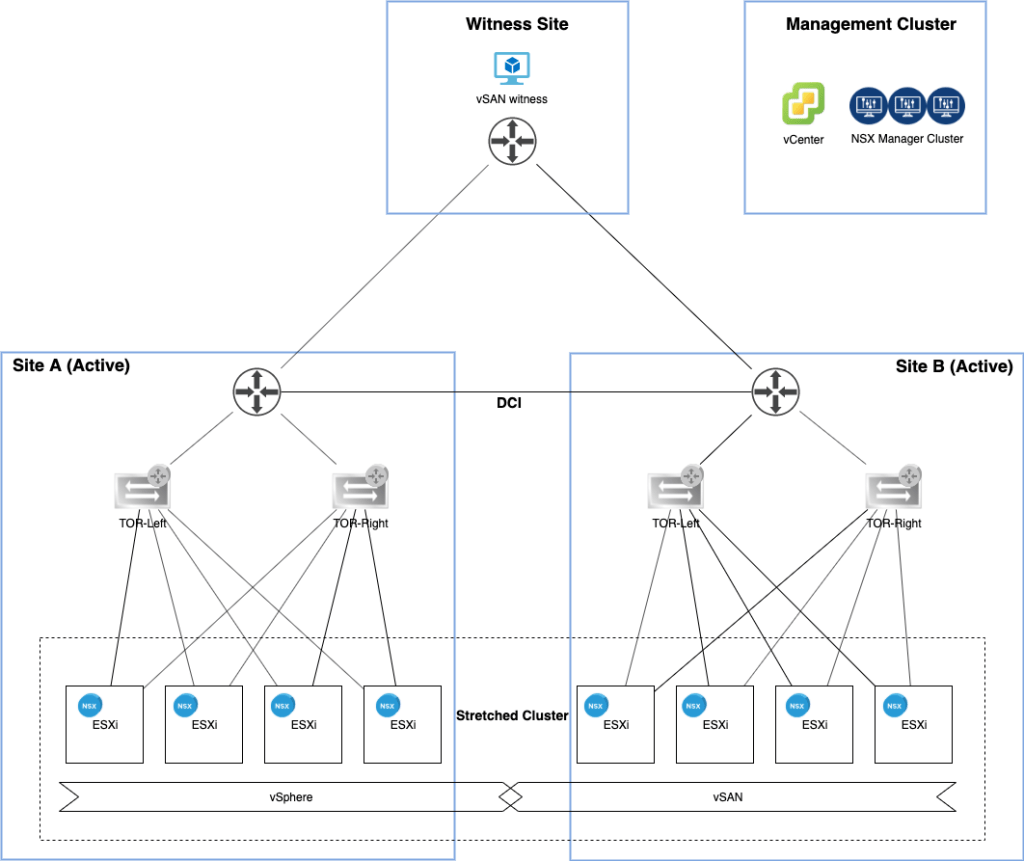
Welcome back! I’m in the process of setting up NSX-T in a stretched cluster environment.
In part 1 I deployed the NSX manager cluster and configured the ESXi hosts as NSX transport nodes. The N-VDS was installed on the ESXi hosts and their vmkernel adapters migrated from the VDS to the N-VDS.
In this second part I will configure the NSX data plane for north-south and east-west networking. Again, there’s a lot to do so let’s begin!
The lab environment
A couple of things happened since the last time I had a look at the lab environment’s diagram:
The vSphere management cluster is now also hosting an NSX manager cluster and the ESXi hosts turned into NSX-T transport nodes.
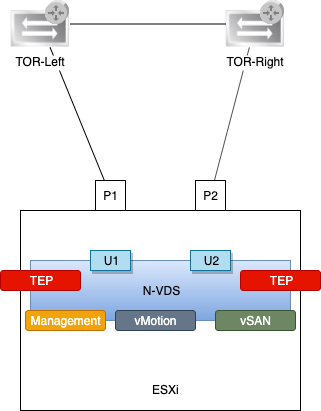
Speaking of ESXi hosts, here’s a little closer look at one of them:
There’s now an N-VDS instead of a VDS with the three vmkernel adapters Management, vMotion, and vSAN. There are also two new vmkernel adapters which are acting as tunnel endpoints (TEPs) for the NSX overlay networking (geneve encapsulation/decapsulation).
The infrastructure for east-west networking is largely in place, but without a north-south network path this cluster is pretty isolated.
NSX Edge
The NSX Edge provides a central entrance/exit point for network traffic entering and exiting the SDDC and is exactly what this environment needs.
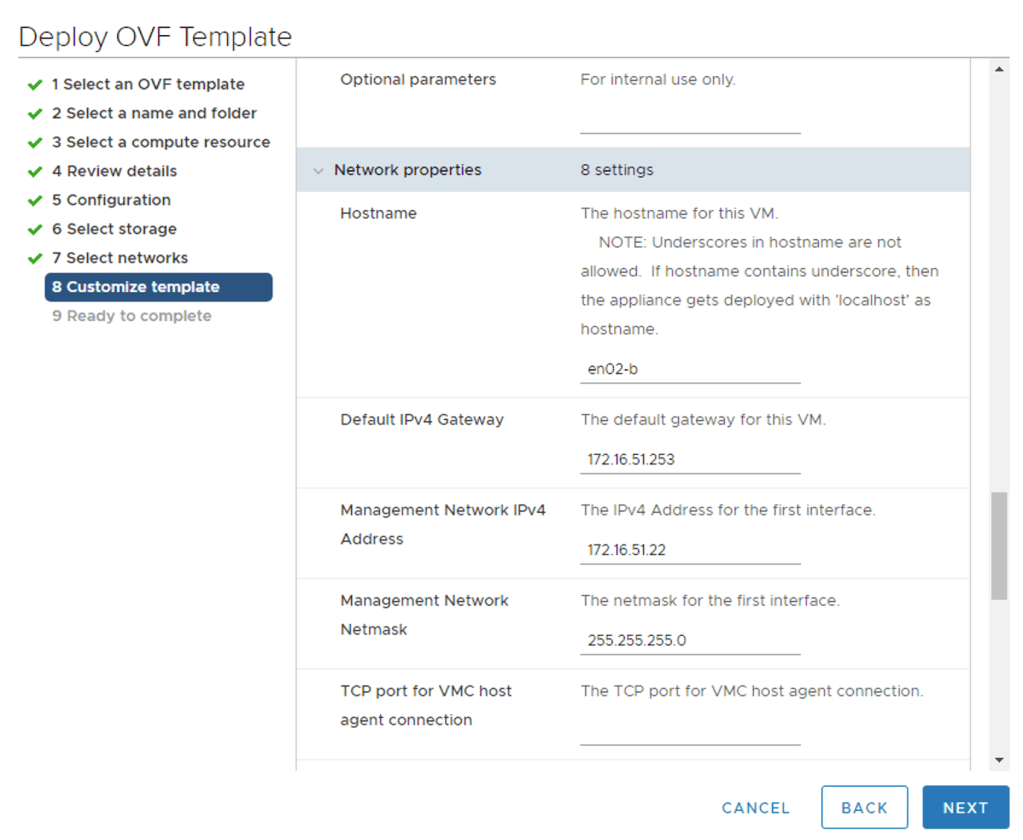
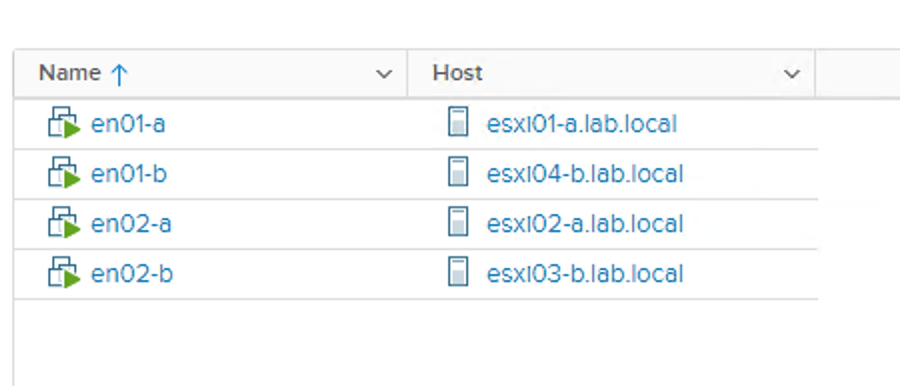
Deploy edge VMs
I’m deploying a total of four edge VMs (two at each site). I’ll deploy them using the Edge VM OVA package so that I can connect the edge node’s management interface to the NSX-T segment at the time of deployment.
The table below contains the deployment details for the edge VMs:
Setting
en01-a
en01-b
en02-a
en02-b
Name
en01-a
en01-b
en02-a
en02-b
Network 0
site-a-nvds01-management
site-b-nvds01-management
site-a-nvds01-management
site-b-nvds01-management
Network 1
edge-uplink1
edge-uplink1
edge-uplink1
edge-uplink1
Network 2
edge-uplink2
edge-uplink2
edge-uplink2
edge-uplink2
Network 3
not used
not used
not used
not used
Mgmt IP
172.16.41.21/24
172.16.51.21/24
172.16.41.22/24
172.16.51.22/24
Deploying the edge VM using the OVA package:
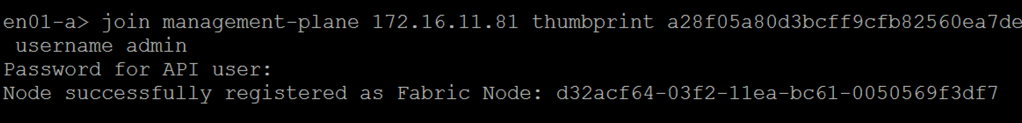
Configure edge nodes
After deployment the edge nodes need to join the management plane. For this I use the “join management-plane” NSX CLI command:
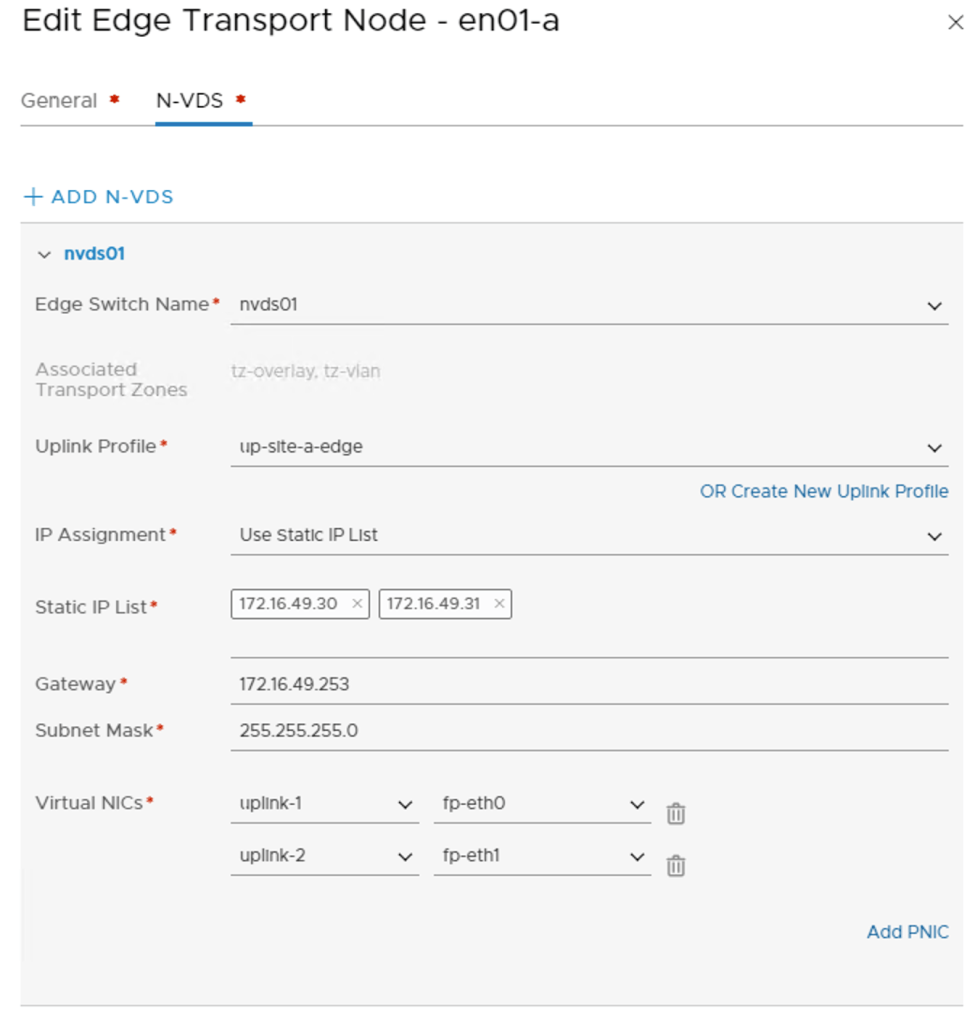
Once he edge nodes have joined the management plane, I can pick them up in the NSX Manager UI to configure each of them as Edge Transport Nodes. I’m using the following configuration details for this :
Setting
en01-a
en01-b
en02-a
en02-b
Transport Zones
tz-vlan, tz-overlay
tz-vlan, tz-overlay
tz-vlan, tz-overlay
tz-vlan, tz-overlay
N-VDS Name
nvds01
nvds01
nvds01
nvds01
Uplink Profile
up-site-a-edge
up-site-b-edge
up-site-a-edge
up-site-b-edge
IP Assignment
Use Static IP List
Use Static IP List
Use Static IP List
Use Static IP List
Static IP List
172.16.49.30,172.16.49.31
172.16.59.30,172.16.59.31
172.16.49.32,172.16.49.33
172.16.59.32,172.16.59.33
Virtual NICs
fp-eth0 – uplink-1, fp-eth1 – uplink-2
fp-eth0 – uplink-1, fp-eth1 – uplink-2
fp-eth0 – uplink-1, fp-eth1 – uplink-2
fp-eth0 – uplink-1, fp-eth1 – uplink-2
Edge transport nodes are managed under System > Fabric > Nodes > Edge Transport Nodes.
Like the ESXi hosts, all four edge nodes are now fully configured transport nodes:
Edge cluster
The edge transport nodes need to be part of an edge cluster. I will create an edge cluster called edge-cluster01 and add all four nodes to this cluster.
Edge clusters are managed under System > Fabric > Nodes > Edge Clusters:
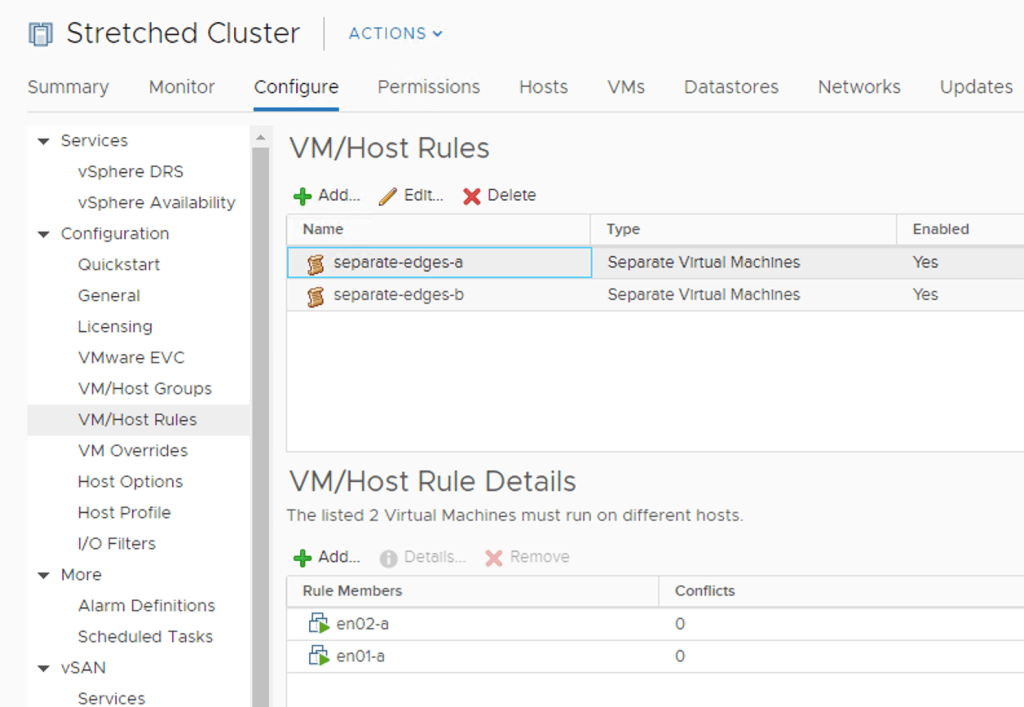
Anti-affinity rules
The edge VMs shouldn’t be running on the same ESXi host. To prevent this from happening I create two anti-affinity rules on the vSphere cluster; one for the edge VMs at Site A and another for the edge VMs at Site B:
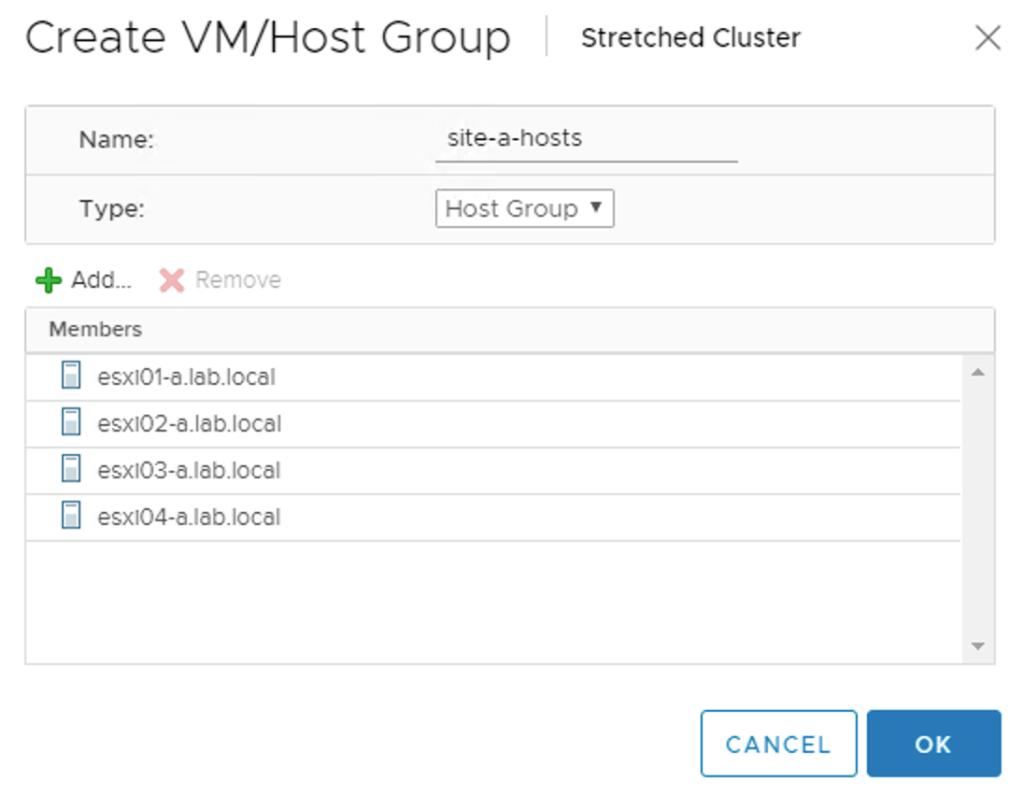
Groups and rules
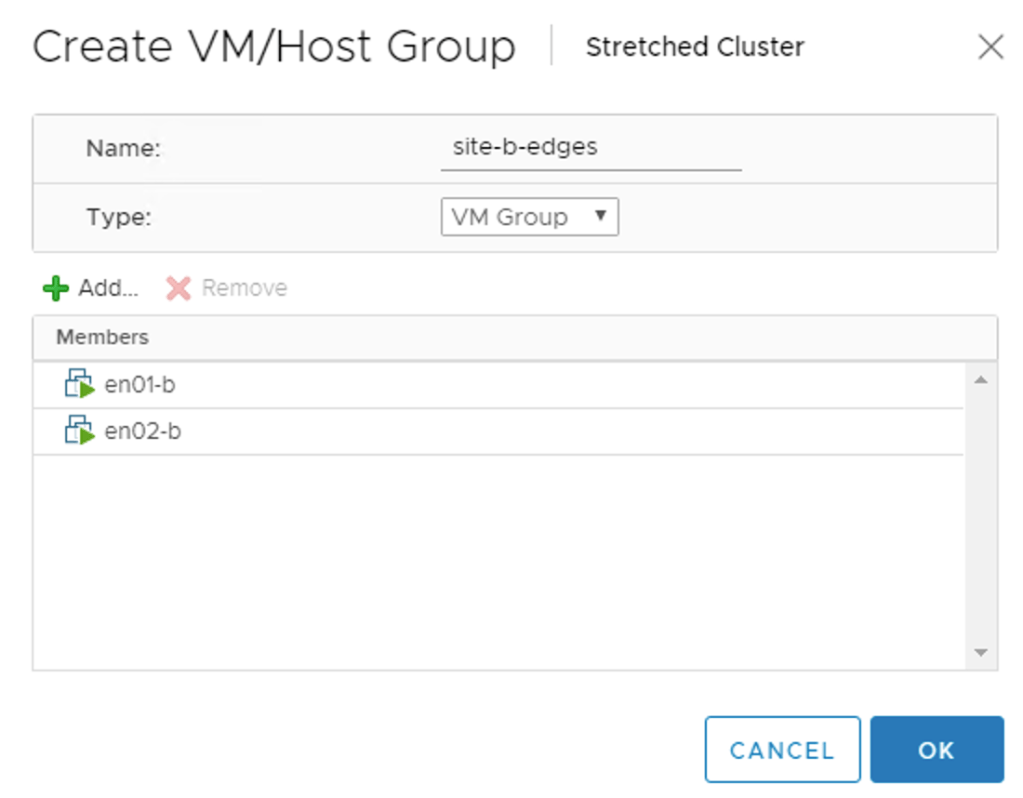
The edge VMs should also stick to their site. For this I create two host and a two VM groups. A “virtual machine to host” rule will then make sure that the edge VMs stay pinned to their respective site.
The host group for Site A:
The VM group for the edge VMs at Site B:
The “virtual machine to host” rule keeping edge VMs belonging to Site A on the ESXi hosts of Site A:
The result of having these groups and rules in place becomes visible after some seconds. Edge VMs are running at the correct site and on seperate ESXi hosts within a site:
That pretty much completes the NSX Edge infrastructure deployment in my stretched cluster.
Routing
Now that the NSX-T Edge is in place, it’s time to set up a connection with the physical network so that packets can actually get in and out of the environment.
Tier-0 gateway
A Tier-0 gateway provides the gateway service between the logical and the physical network and is just what I need.
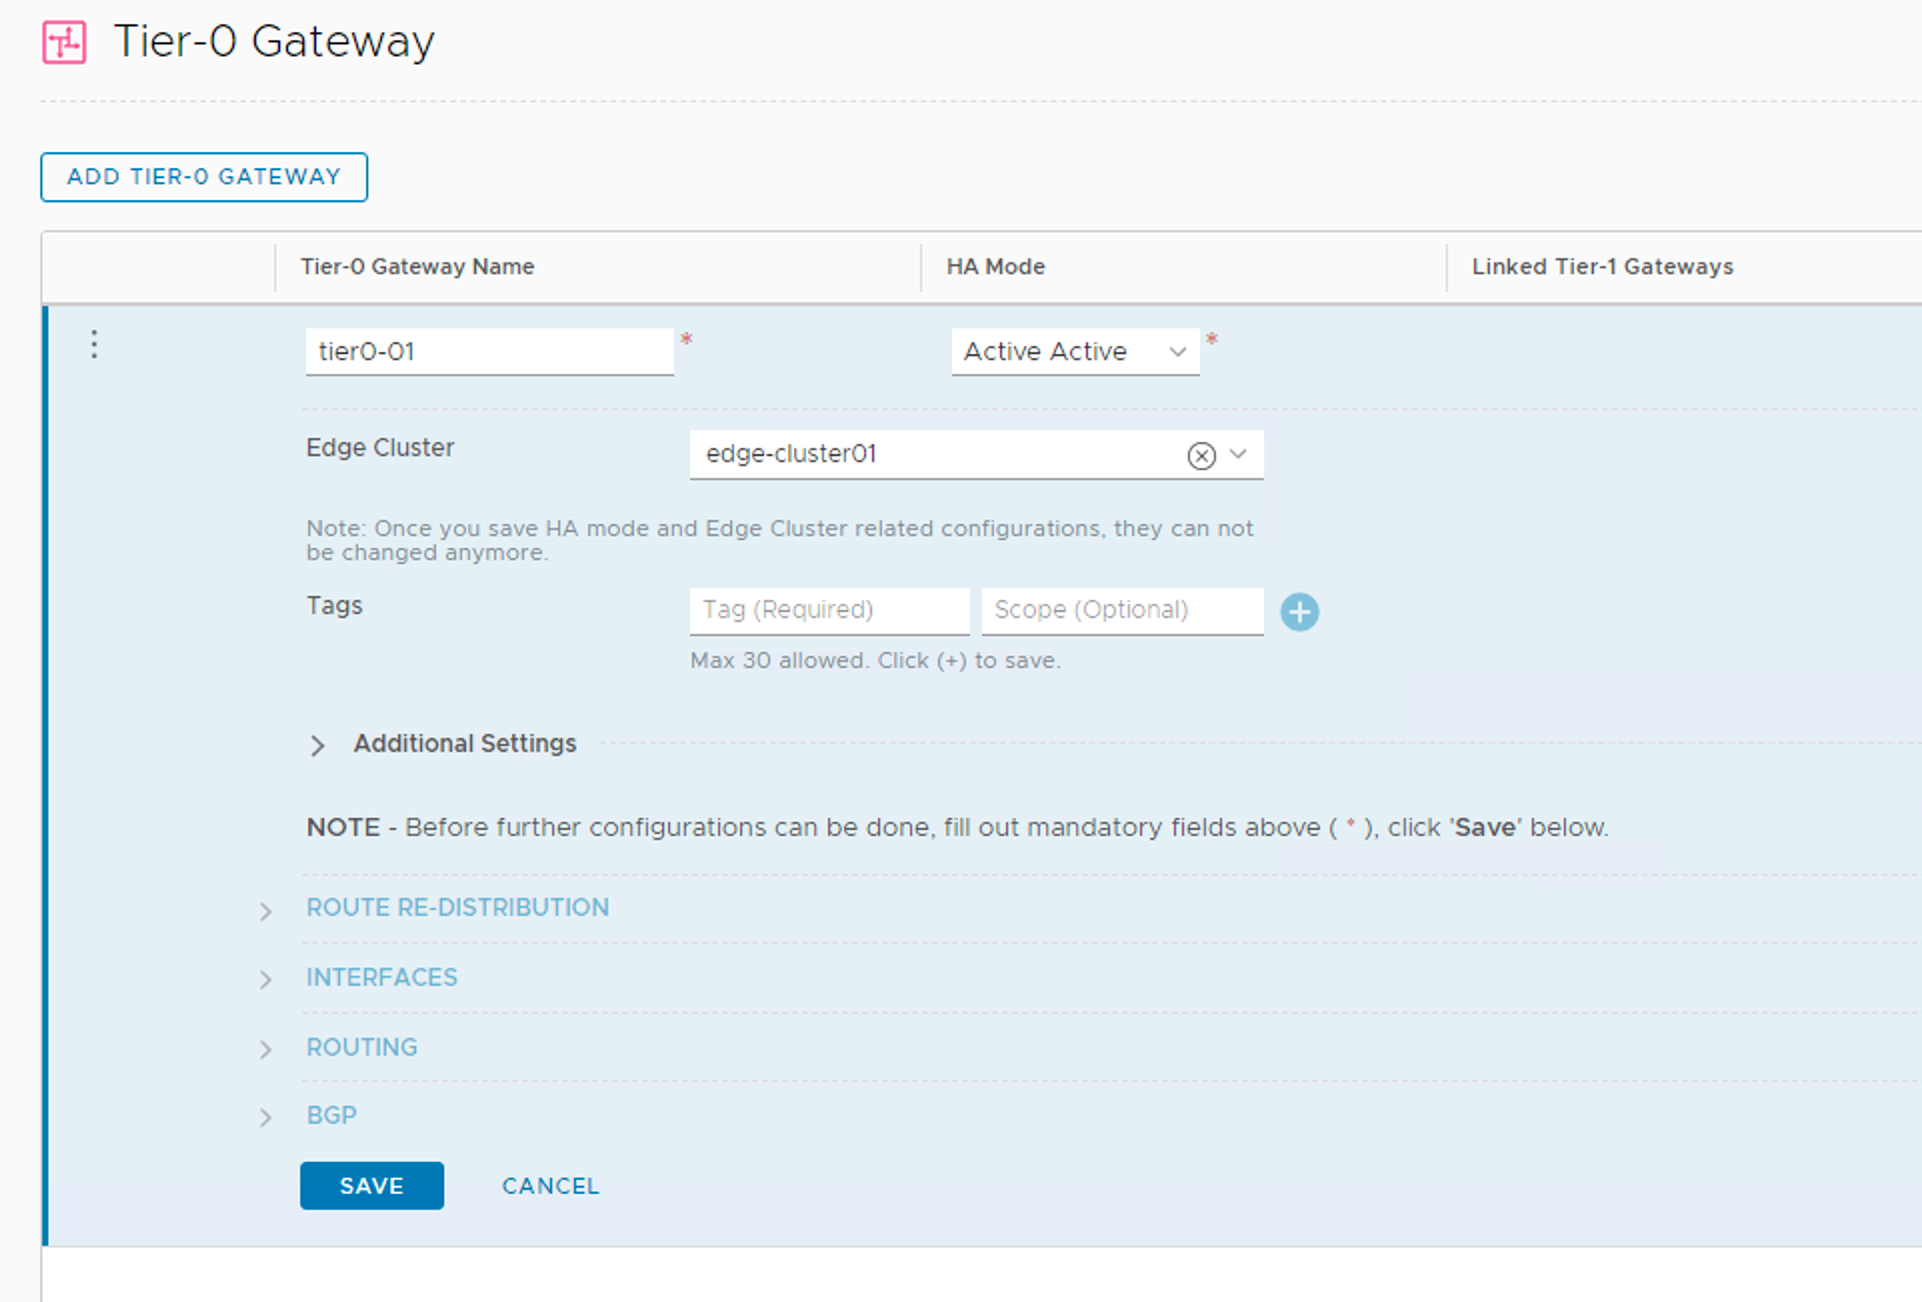
I’m creating my Tier-0 gateway with the following configuration details:
Setting
Value
Name
tier0-01
High Availability Mode
Active-Active
Edge Cluster
edge-cluster01
Route Re-Distribution
all
Tier-0 gateways are managed under Networking > Connectivity > Tier-0 Gateways.
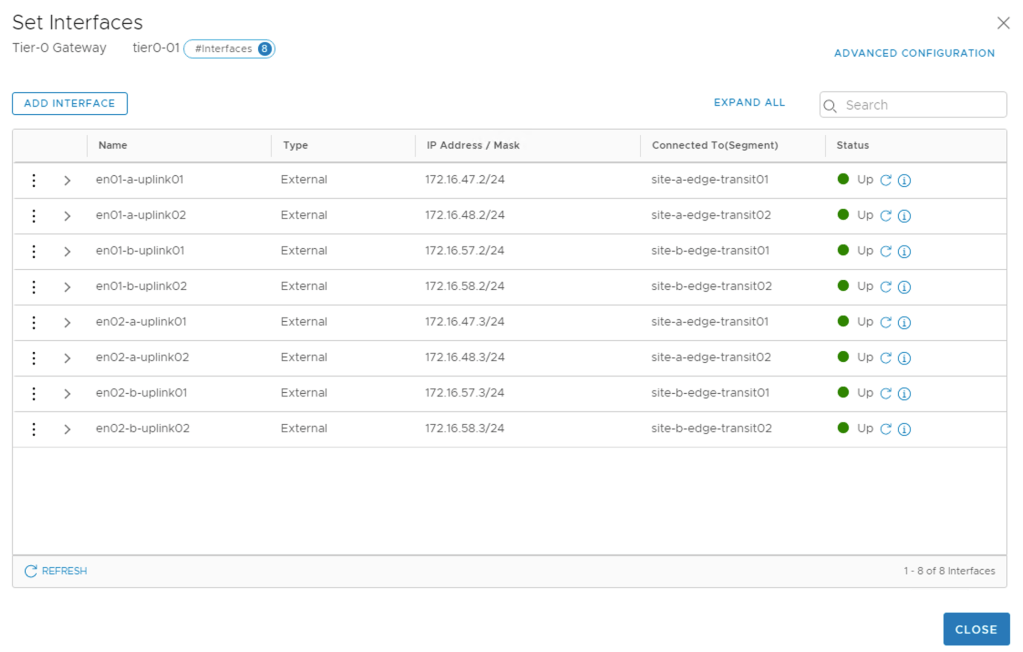
Interfaces
This Tier-0 will have eight external interfaces mapped to the different edge transport nodes at the two sites. The table below shows the interfaces and their configuration details:
Name
IP Address / Mask
Connected To
Edge Node
MTU
en01-a-uplink01
172.16.47.2/24
site-a-edge-transit01
en01-a
9000
en01-a-uplink02
172.16.48.2/24
site-a-edge-transit02
en01-a
9000
en02-a-uplink01
172.16.47.3/24
site-a-edge-transit01
en02-a
9000
en02-a-uplink02
172.16.48.3/24
site-a-edge-transit02
en02-a
9000
en01-b-uplink01
172.16.57.2/24
site-b-edge-transit01
en01-b
9000
en01-b-uplink02
172.16.58.2/24
site-b-edge-transit02
en01-b
9000
en02-b-uplink01
172.16.57.3/24
site-b-edge-transit01
en02-b
9000
en02-b-uplink02
172.16.58.3/24
site-b-edge-transit02
en02-b
9000
The Tier-0 external interfaces are now configured and active:
BGP
The TORs have been configured for BGP already and now I need to set up BGP at the Tier-0 gateway too.
The BGP settings that I will use on the Tier-0 gateway are:
Setting
Value
Local AS
65000
BGP
On
Graceful Restart
Off
Inter SR iBGP
On
ECMP
On
Multipath Relax
On
Configuring BGP details on the Tier-0 gateway:
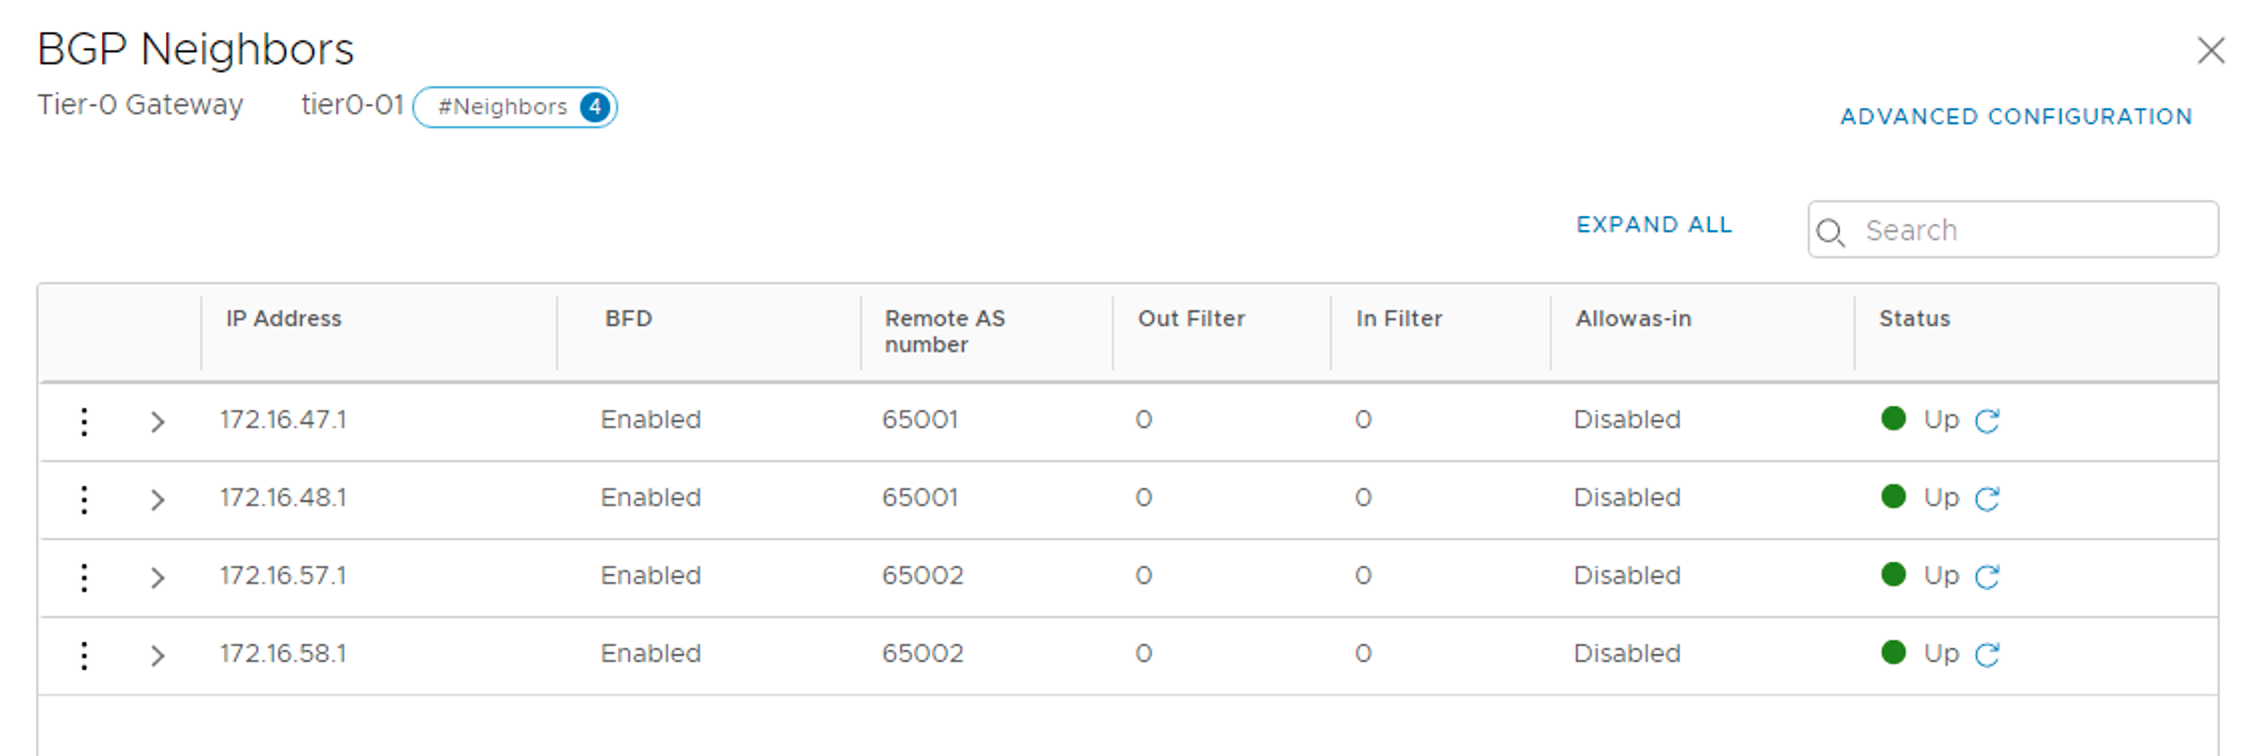
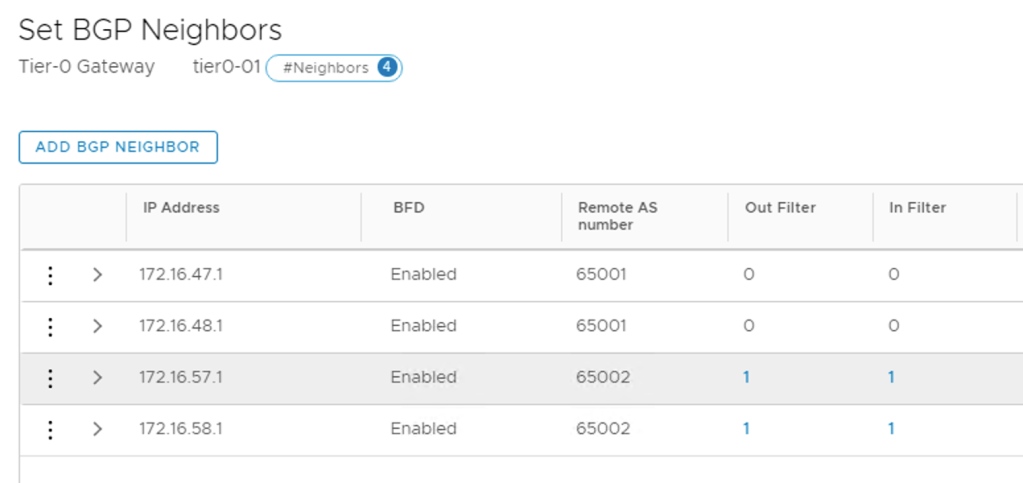
I’m adding each TOR as a BGP neighbor to the Tier-0 gateway. The following table shows the configuration details for the four BGP neighbor entries:
IP address
BFD
Remote AS
Hold Down
Keep Alive
172.16.47.1
Enabled
65001
12
4
172.16.48.1
Enabled
65001
12
4
172.16.57.1
Enabled
65002
12
4
172.16.58.1
Enabled
65002
12
4
The BGP neighbor status after the four TORs are added:
Route map
To prevent asymmetric traffic flows, the NSX Edge infrastructure at Site A should be the preferred ingress/egress point for the north-south traffic.
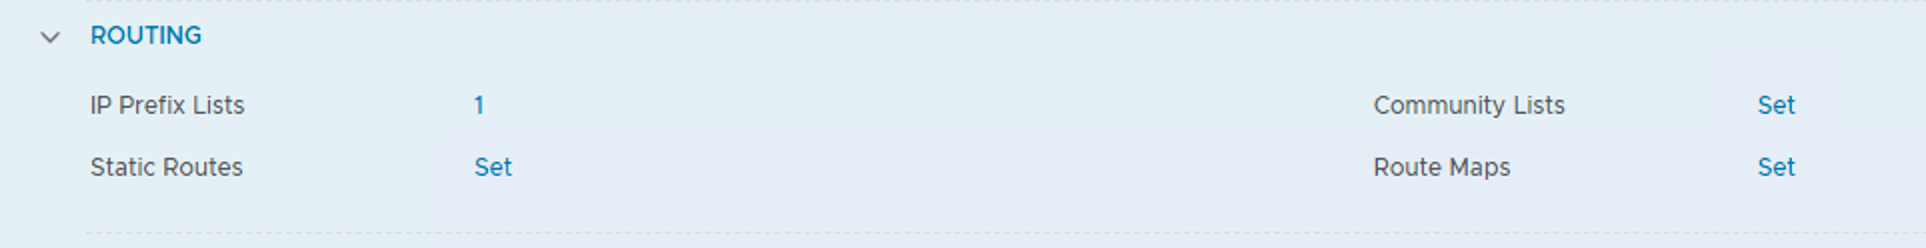
I achieve this by AS path prepending on the BGP paths to Site B. This is configured in a route map on the Tier-0 gateway.
First I need to create an IP prefix list. Both IP prefix lists and route maps are managed on the Tier-0 gateways under Routing:
The details of the IP prefix list:
Setting
Value
Name
any-prefix
Network
any
Action
Permit
The details of the route map:
Setting
Value
Route Map Name
siteb-route-map
Type
IP Prefix
Members
any-prefix
AS path prepend
65000 65000
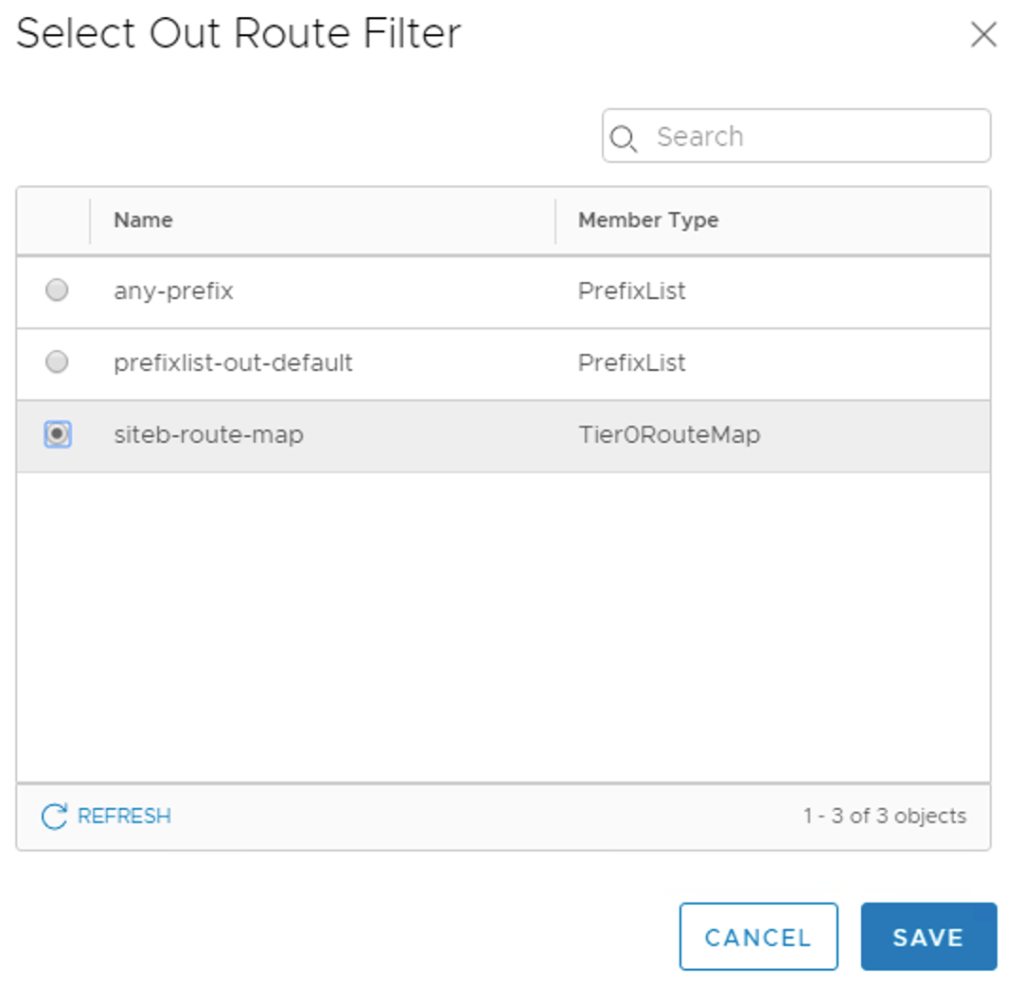
The route map needs to be attached to the BGP neighbor entries belonging to Site B. I configure the route map as Out Filter and In Filter:
The Site B neighbors now have filters configured:
This completes the Tier-0 gateway deployment.
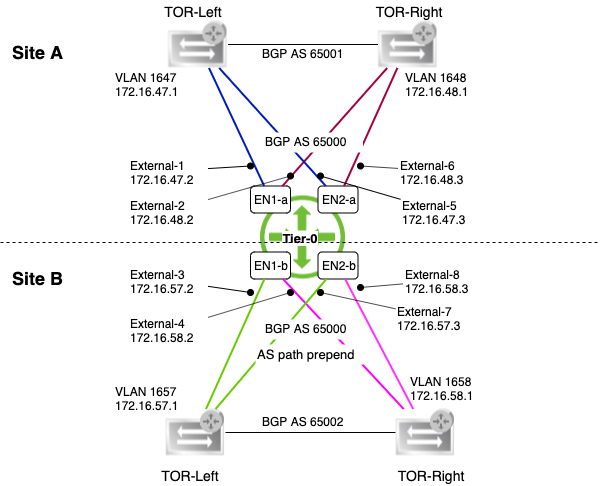
Diagram
I’m just taking a step back to have a look at what it is I actually did here.
The diagram below shows the Tier-0 gateway’s L3 connectivity with the physical network:
It’s a pretty wild diagram I’m aware, but hopefully it makes some sense.
East-West
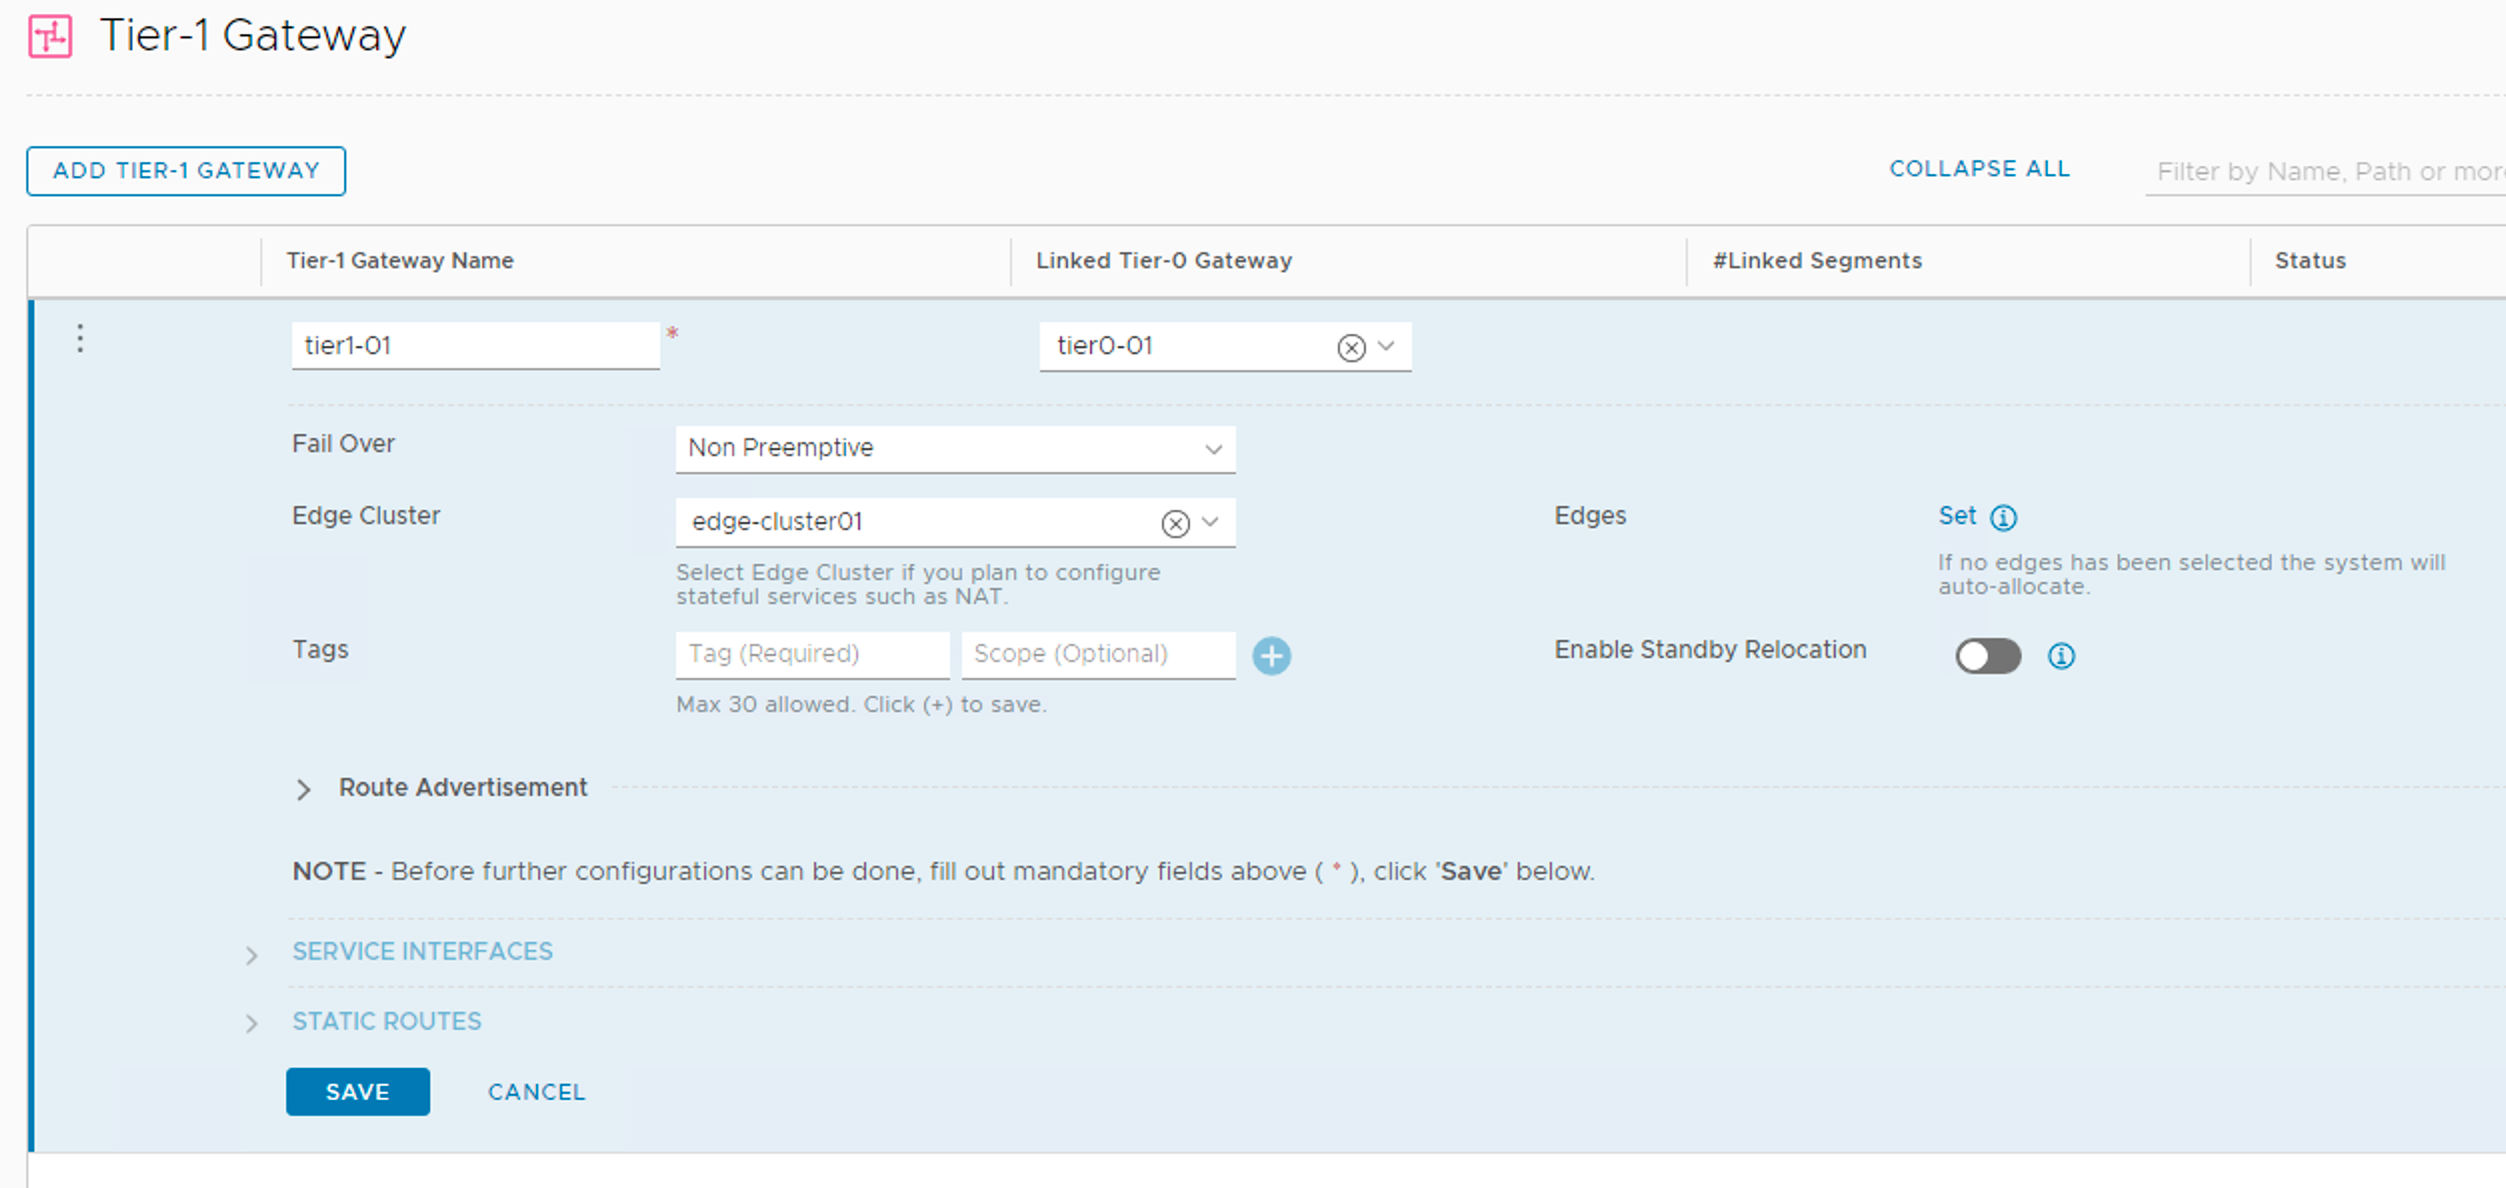
The Tier-1 gateway is where the NSX-T segments for virtual machine networking will be connected. The Tier-1 gateway is linked to the Tier-0 gateway too, of course.
I’m creating a Tier-1 gateway with the following configuration details:
Setting
Value
Name
tier1-01
Linked Tier-0 Gateway
tier0-01
Fail Over
Non Preemptive
Edge Cluster
edge-cluster01
Route Advertisement
all
Tier-1 gateways are managed under Networking > Connectivity > Tier-1 Gateways.
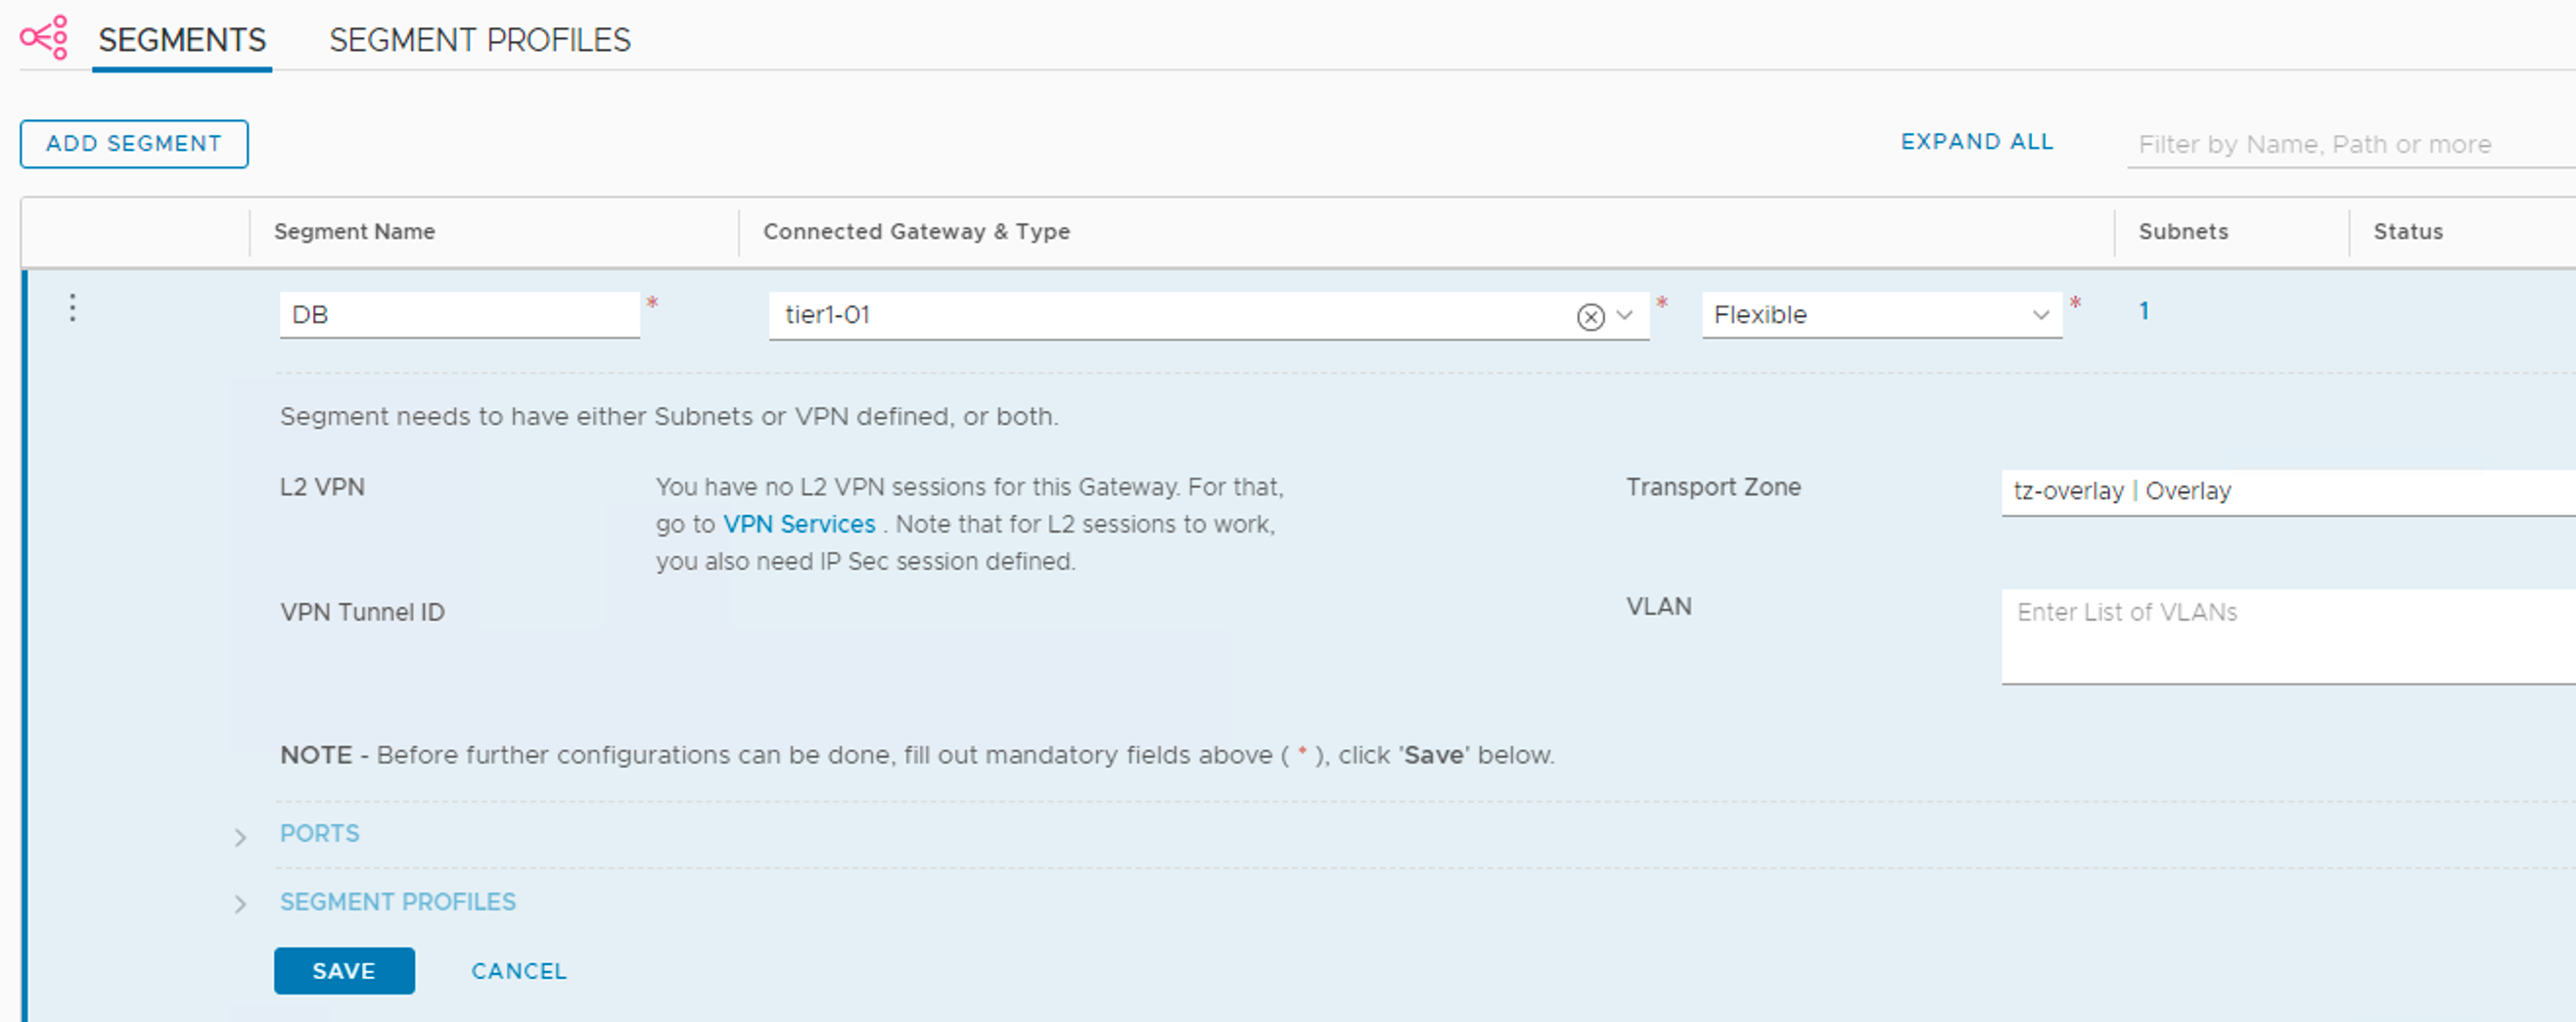
Workload segments
With the Tier-1 gateway in place I can now attach some NSX-T segments for the workloads (VMs).
I’m creating three segments Web, App, and DB with the following configuration details:
Setting
Value
Connected Gateway & Type
tier1-01, flexible
Transport Zone
tz-overlay
Subnets (gateway)
10.0.1.1/24 (Web), 10.0.2.1 (App), 10.0.3.1 (DB)
Creating the segments:
I notice that downlink ports have been created on the Tier-1 gateway:
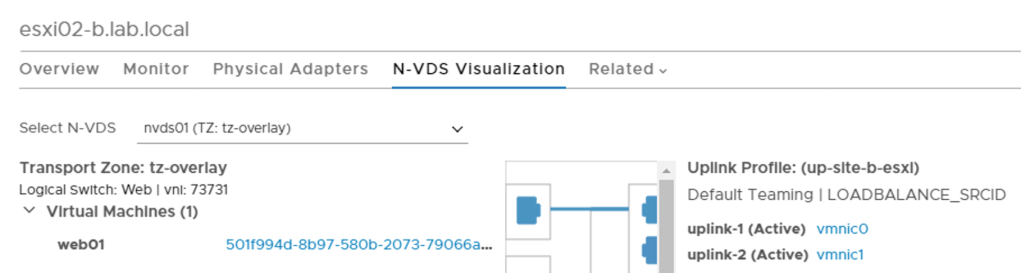
Provision VMs
It’s all about the VMs of course. So I deploy three VMs web01, app01, and db01. They are connected to the segments.
VM web01 connected to segment Web as seen at the N-VDS Visualization in the NSX Manager UI:
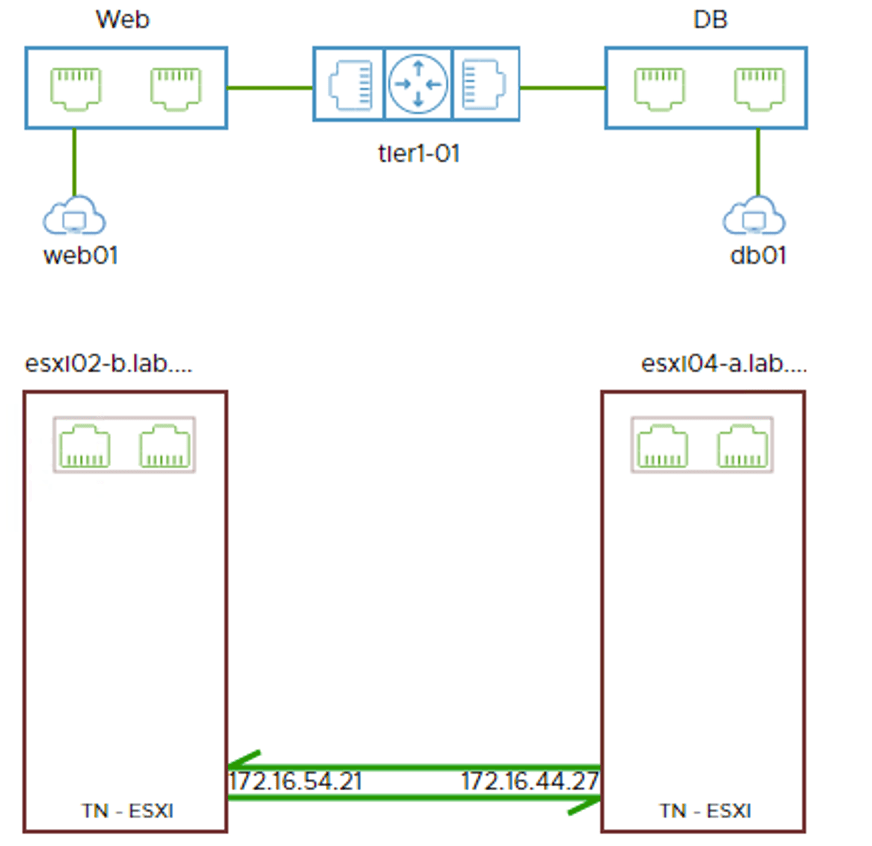
Connectivity test
Time to test connectivity.
East-west
First between the VMs which I place on different ESXi hosts and at different sites.
web01 (10.0.1.10) at Site B pinging db01 (10.0.3.10) at Site A:
Visualized by the Port Connection tool in the NSX Manager UI:
app01 (10.0.2.10) at Site A pinging web01 at Site B:
Once again visualized by the Port Connection tool:
East-west and cross-site logical networking seems to be working!
North-south
How about north-south? Let’s see.
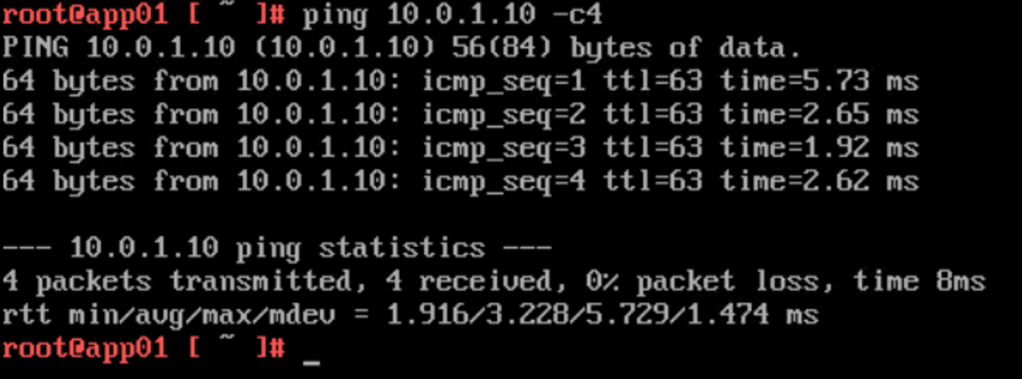
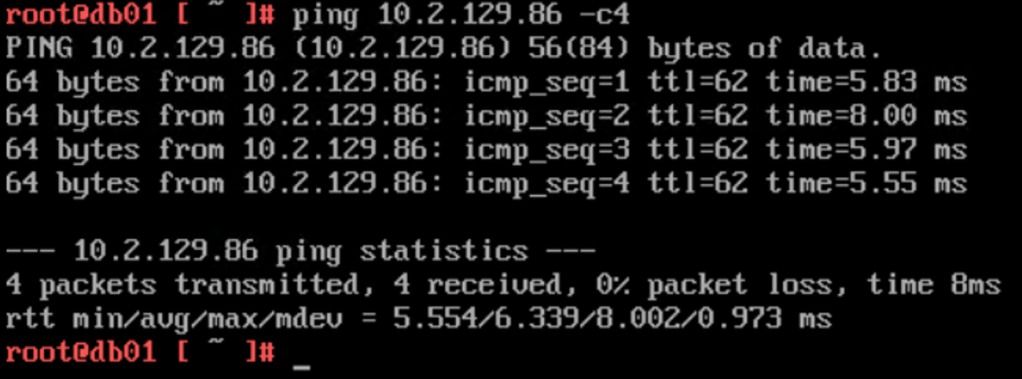
db01 at Site A pinging a host on the physical network (10.2.129.86):
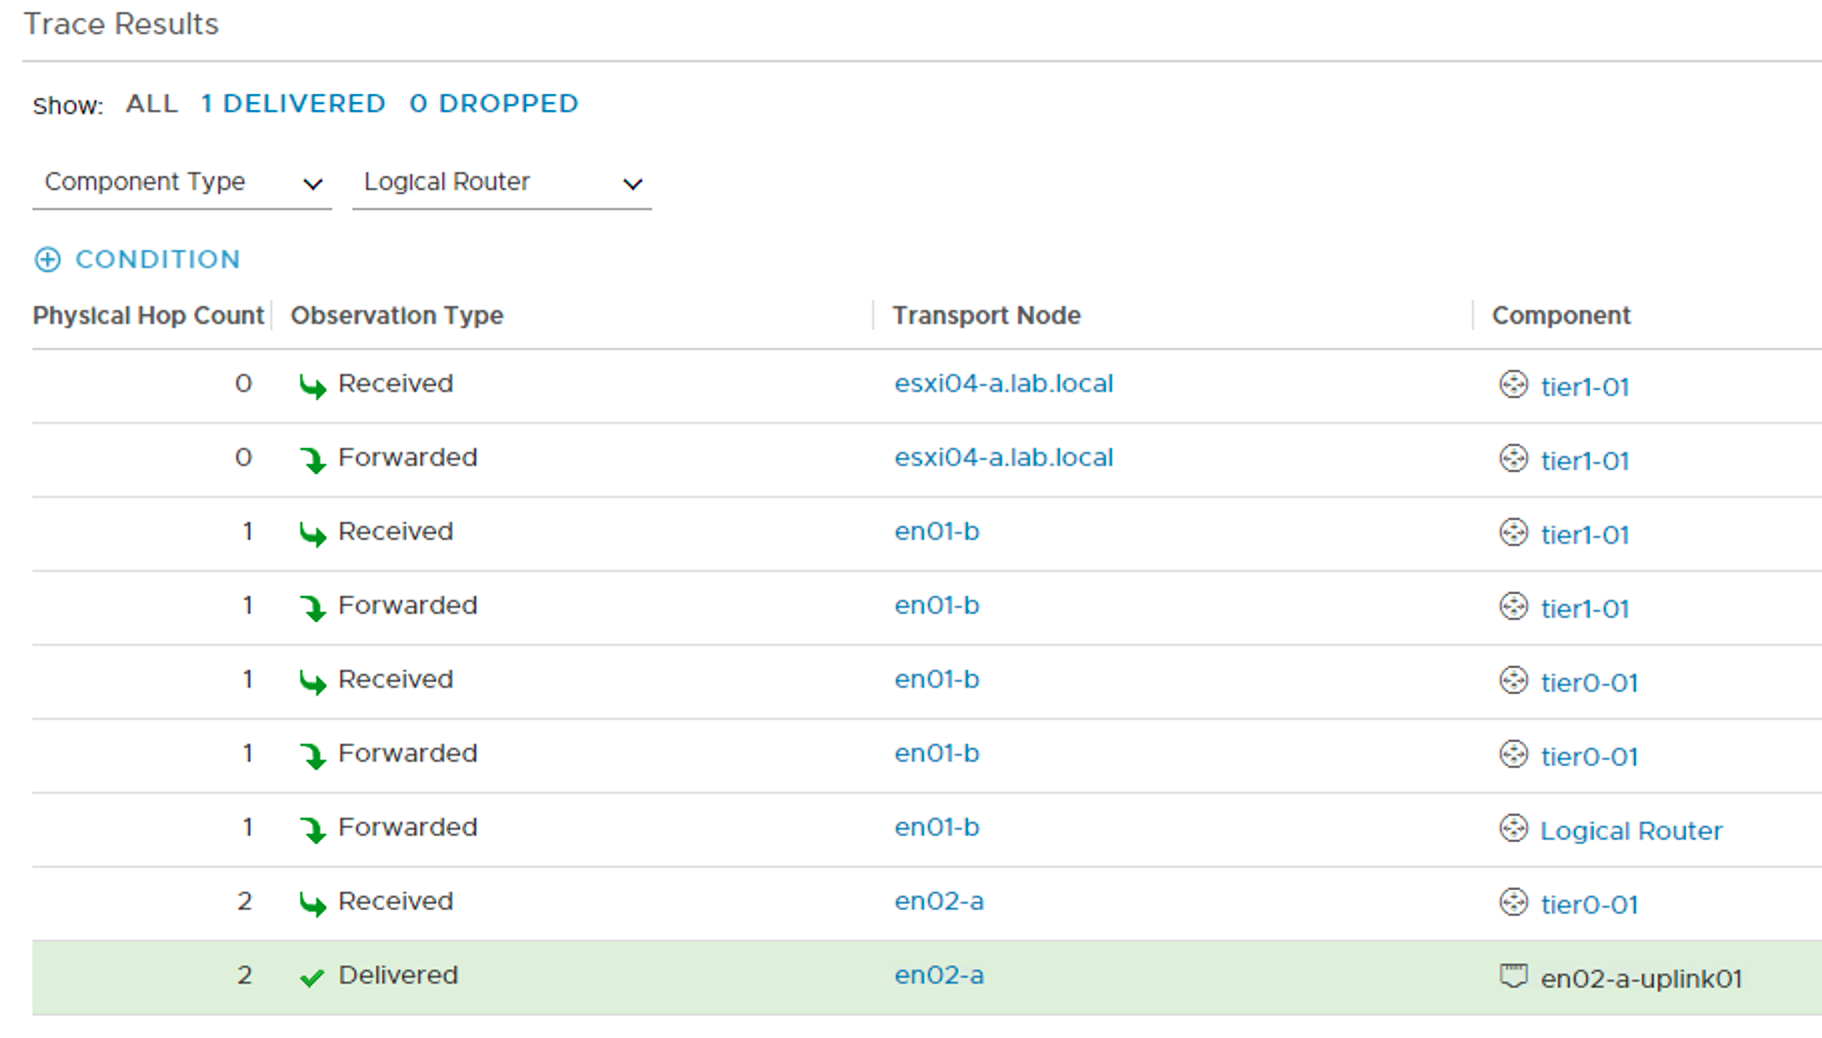
The Traceflow tool in the NSX Manager UI tells me a bit more about the network path. I can see that the traffic exits the SDDC through Site A (en02-a):
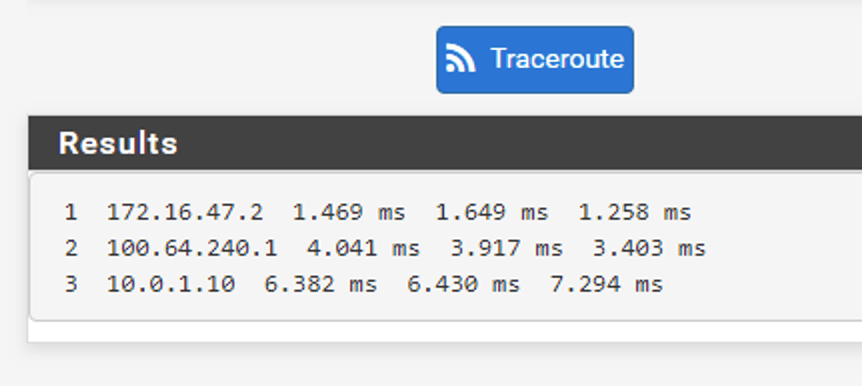
The other way around a traceroute from the physical network to web01 at Site B:
Traffic entering the SDDC through Site A (en01-a). Perfect!
Summary
Wow! This has been quite an exercise. Are you still there? 😉
It all started with deploying the NSX Edge (virtual) infrastructure. On top of that infrastructure I deployed a Tier-0 gateway and configured dynamic routing between the Tier-0 and the TORs.
To facilitate for east-west distributed logical networking, I deployed a Tier-1 gateway and linked it to the Tier-0. I connected some NSX-T segments to the Tier-1 gateway and some virtual machines to the segments.
Some simple connectivity testing showed that north-south and east-west networking were working as intended. Site A is consistently used for the north-south ingress/egress traffic flows thanks to the BGP AS prepending.
Thanks for staying tuned this long. I hope this and the previous article about deploying NSX-T in a stretched cluster environment have been interesting reads. I might return to this environment for some more NSX-T multisite scenarios in future articles.