NSX-T version 3.0 brings a new routing construct to the table: VRF Lite. With VRF Lite we are able to configure per tenant data plane isolation all the way up to the physical network. Creating dedicated tenant Tier-0 Gateways for this particular use case is now a thing of the past!

With 100 VRFs per Tier-0 Gateway we’re also looking at a quite substantial improvement from a scalability point of view.
A closer look
VRF Lite in NSX-T 3.0 has the following main features and characteristics:
- Each VRF maintains its own routing table.
- A VRF acts as a virtual Tier-0 Gateway associated with a “parent” Tier-0 Gateway.
- Inter-VRF traffic is either routed through the physical fabric or directly by using static routes.
As a child object of a Tier-0 Gateway, the VRF inherits some attributes and configuration from its parent. Edge cluster, HA mode, BGP local AS number, and BGP graceful restart settings are inherited and can’t be changed at the VRF level. All other configuration is managed independently within the VRF. This includes external interfaces, BGP state, BGP neighbors, routes, route filters, route redistribution, NAT, and Edge firewall.
Caveats
There are some things to keep in mind when working with NSX-T VRF Lite:
- Bandwidth is shared across all Tier-0 Gateways and VRFs.
- The Tier-0 Gateway’s HA mode (A/A or A/S) is inherited by the VRF. This is an important consideration when talking stateful services on the VRF level.
- Inter-SR routing for VRF routing instances is not possible today.
- Inter-VRF static routing does not work with NAT. Route through the physical fabric instead.
Not too bad.
Setting up VRF Lite
Let’s have a look at how to set up VRF Lite for two new tenants: Blue and Green.
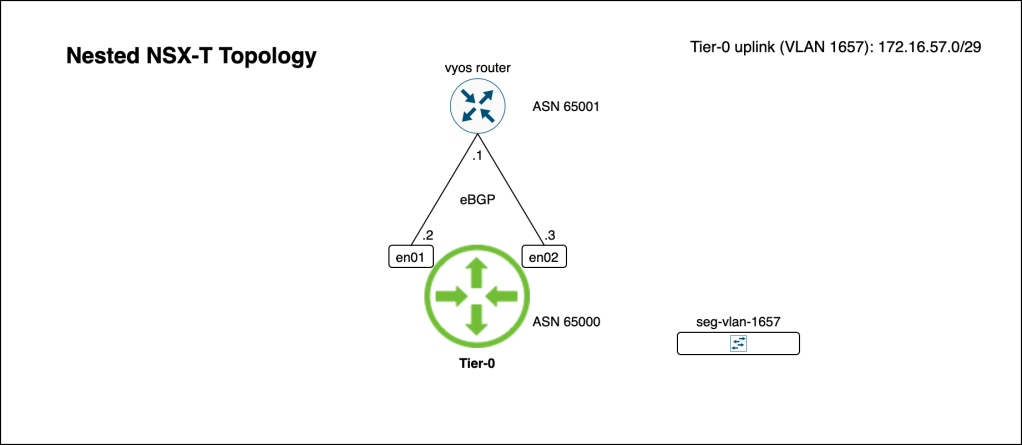
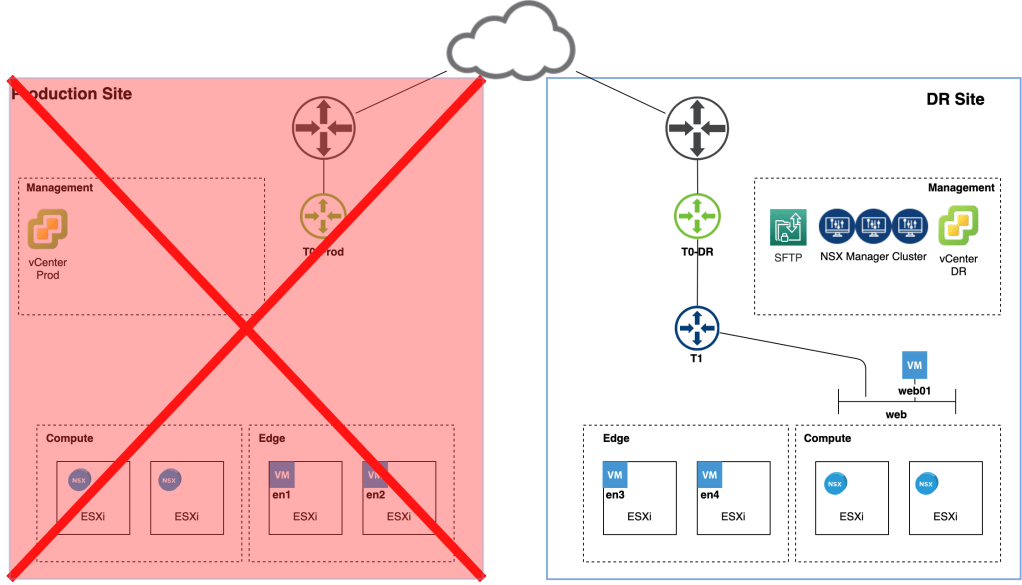
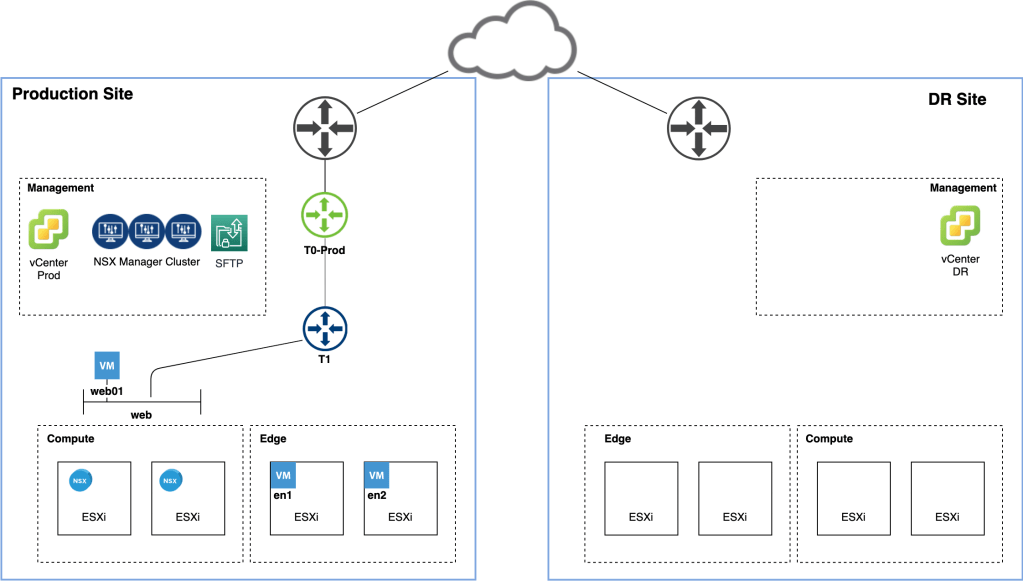
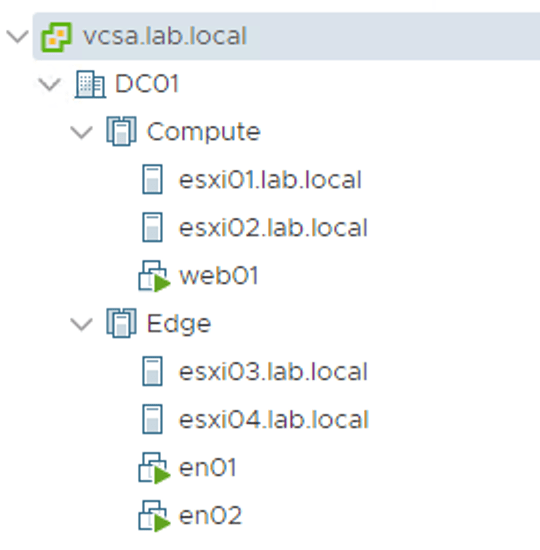
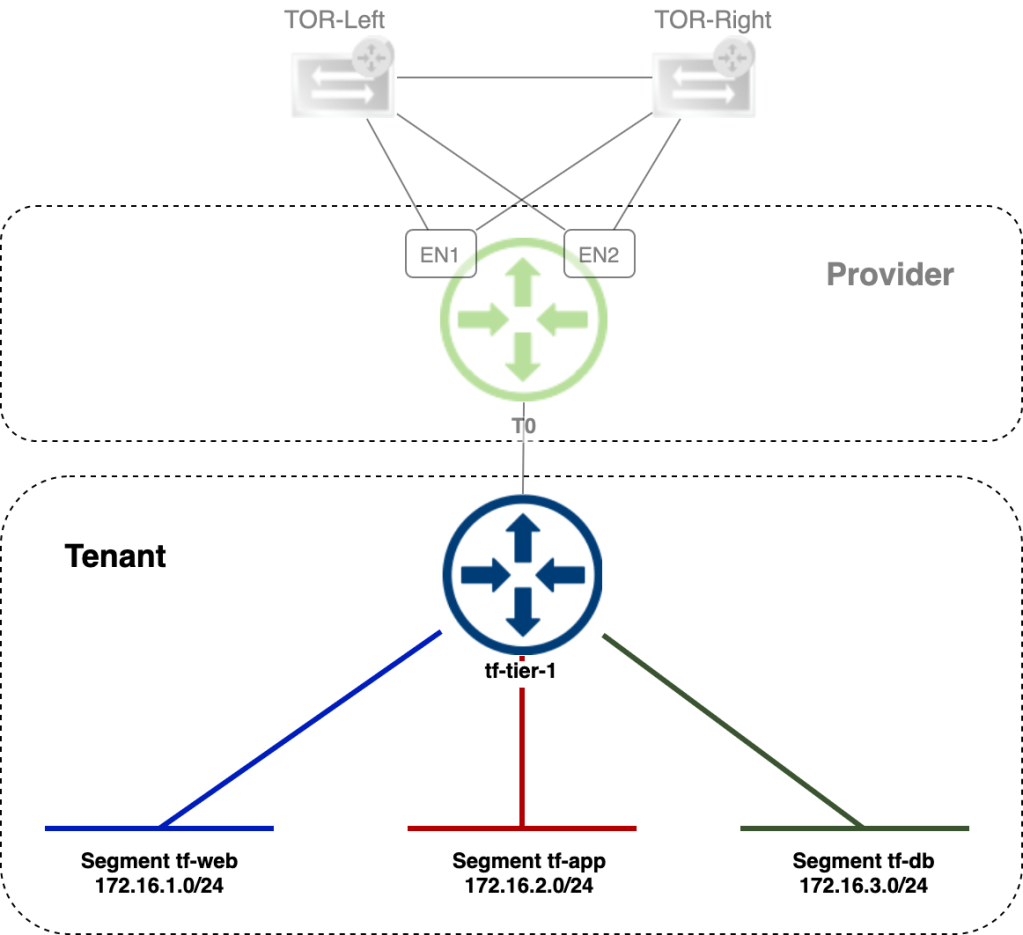
In this simple walkthrough the assumption is that a Tier-0 Gateway with external interfaces is already configured. BGP should be enabled but peering or neighbor entries are not required. As a reference, in my lab environment the starting point looks like this:

A Tier-0 Gateway configured with Active/Standby HA mode and four external interfaces (two per Edge node) connecting it to the two ToRs.
Step 1 – Create VLAN segments
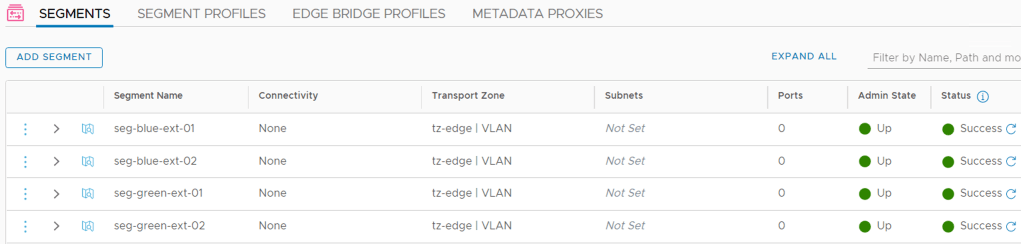
Just like its parent, a VRF needs VLAN-based uplink segments for establishing connectivity with the physical network:

Note that we configure a VLAN range indicating that the segment will be trunking VLANs within that range. Trunking segments are required for VRF uplinks.
In total we create four uplink segments for our two VRFs:
| Segment | VLAN range | Uplink Teaming Policy |
|---|---|---|
| seg-blue-ext-01 | 1-50 | teaming-1 |
| seg-blue-ext-02 | 1-50 | teaming-2 |
| seg-green-ext-01 | 51-100 | teaming-1 |
| seg-green-ext-02 | 51-100 | teaming-2 |
The uplink teaming policies make sure that traffic from each segment is steered towards specific Edge node N-VDS uplinks. This is done to establish a deterministic routing path.
Step 2 – Create the VRFs
Creating VRFs in NSX Manager is done under Networking > Connectivity > Tier-0 Gateways > Add Gateway > VRF:
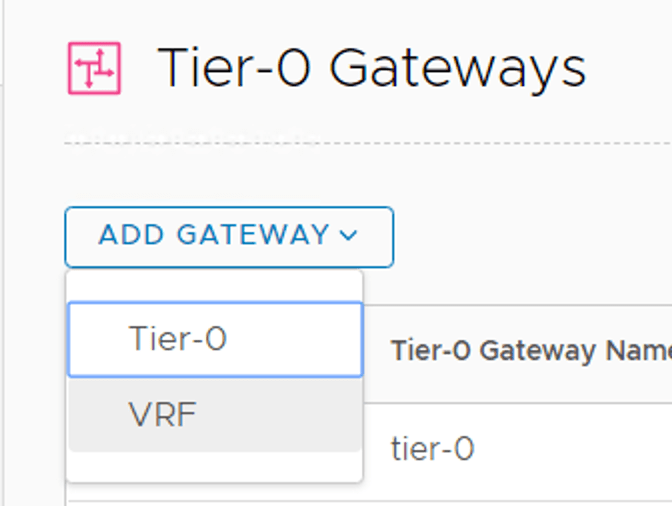
When creating a VRF we initially only need to specify a name and a parent Tier-0 Gateway:

After repeating this process for the “Green” VRF we have our two VRFs as well as the Tier-0 Gateway in place:
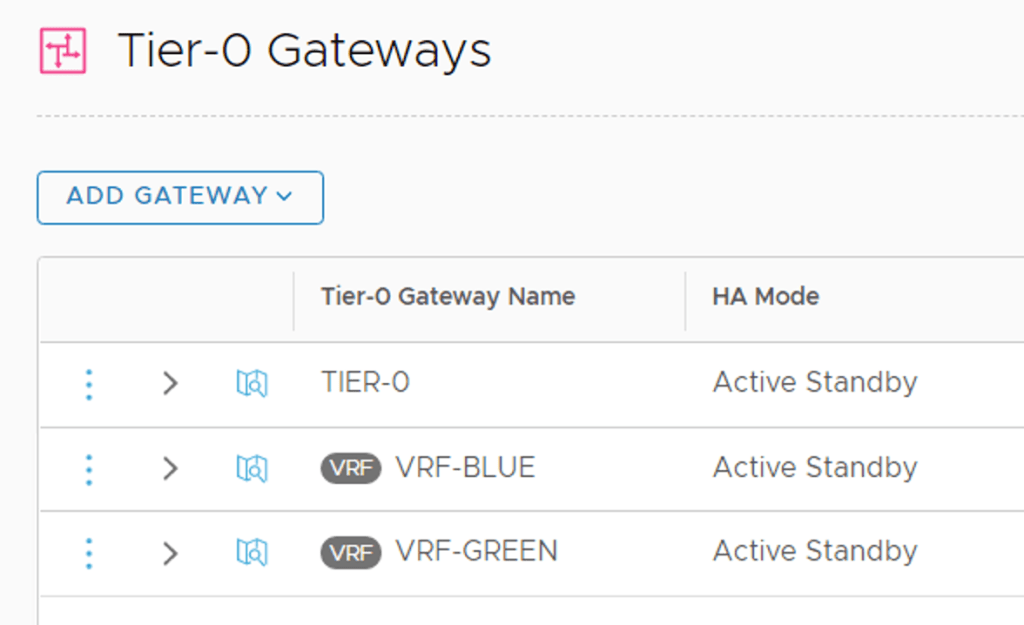
Are we done now? No.
Step 3 – Create VRF external interfaces
Just like Tier-0 Gateways, VRFs need external interfaces to connect to the physical network.
In this scenario each VRF is configured with four external interfaces as specified in the table below:
| VRF | Interface Name | IP Address | Segment | Access VLAN |
|---|---|---|---|---|
| Blue | en01-uplink1 | 10.203.28.2/24 | seg-blue-ext-01 | 28 |
| Blue | en01-uplink2 | 10.203.29.2/24 | seg-blue-ext-02 | 29 |
| Blue | en02-uplink1 | 10.203.28.3/24 | seg-blue-ext-01 | 28 |
| Blue | en02-uplink2 | 10.203.29.3/24 | seg-blue-ext-02 | 29 |
| Green | en01-uplink1 | 10.203.58.2/24 | seg-green-ext-01 | 58 |
| Green | en01-uplink2 | 10.203.59.2/24 | seg-green-ext-02 | 59 |
| Green | en02-uplink1 | 10.203.58.3/24 | seg-green-ext-01 | 58 |
| Green | en02-uplink2 | 10.203.59.3/24 | seg-green-ext-02 | 59 |
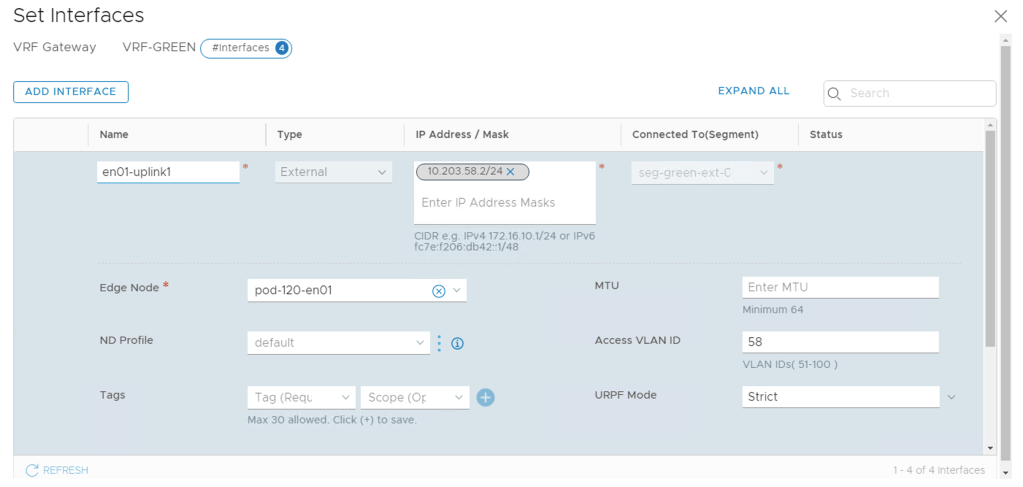
As you remember, the segments that the external interfaces connect into are configured as trunk segments. Therefore we use the “Access VLAN” property on the VRF external interfaces to specify the BGP peering VLANs.
Step 4 – Configure BGP
With the L2 connectivity in place we can move our focus to L3. As stated earlier, VRFs inherit their BGP local AS number and some other BGP settings from their parent Tier-0, but BGP neighbor configuration is done within each VRF.
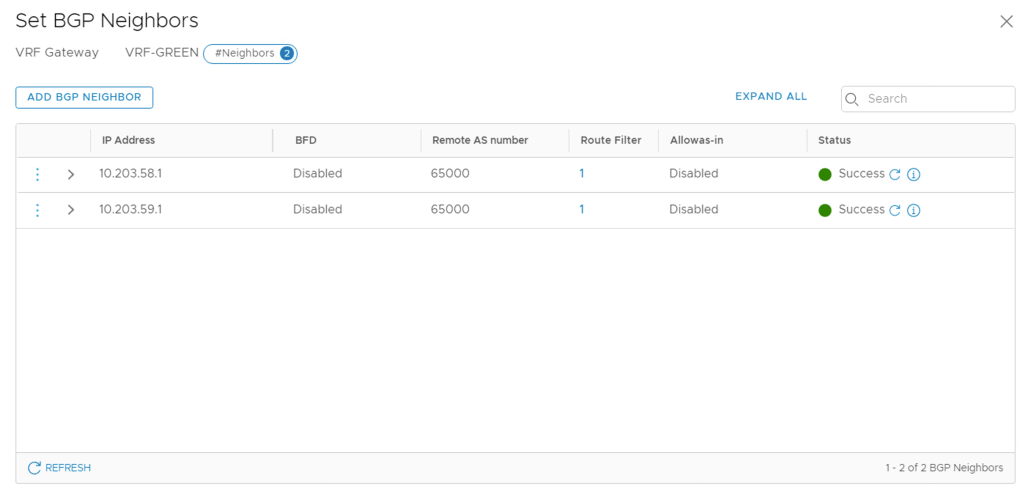
Configuring BGP neighbors within a VRF is done exactly the same way as on a Tier-0 Gateway:

There’s not much to explain here. In this particular scenario each VRF gets two BGP neighbor entries (one for each ToR):
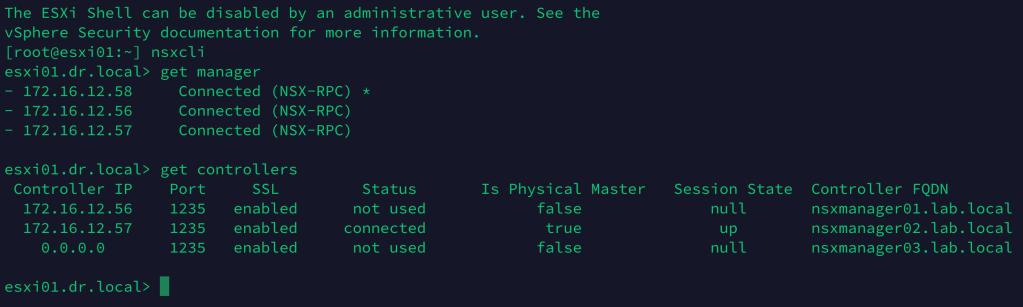
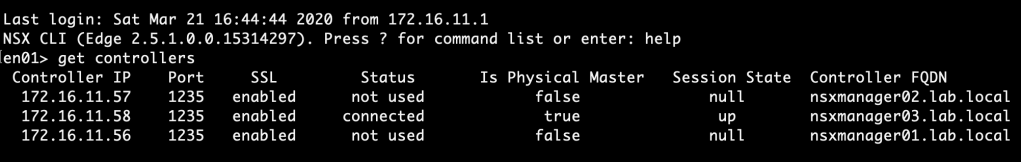
Once the neighbor configurations are in place we can have a look at things from the Edge node CLI:
get logical-router

Here we see the two VRFs that we just configured.
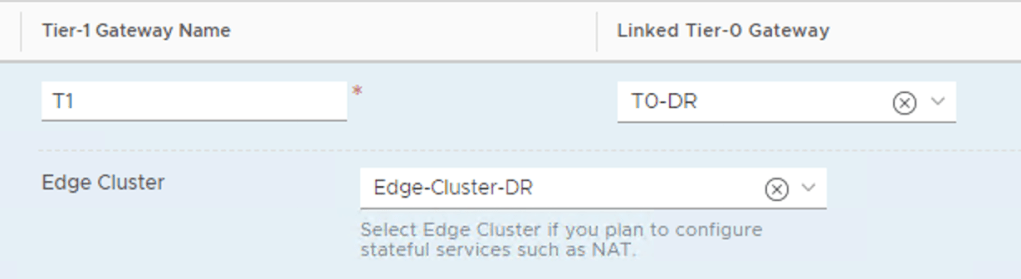
After connecting a Tier-1 Gateway to each of the VRFs we can see that DR components are being instantiated for the VRFs:
get logical-router

From within a VRF context we can check things like the BGP neighbor status:
vrf 5
get bgp neighbor summary

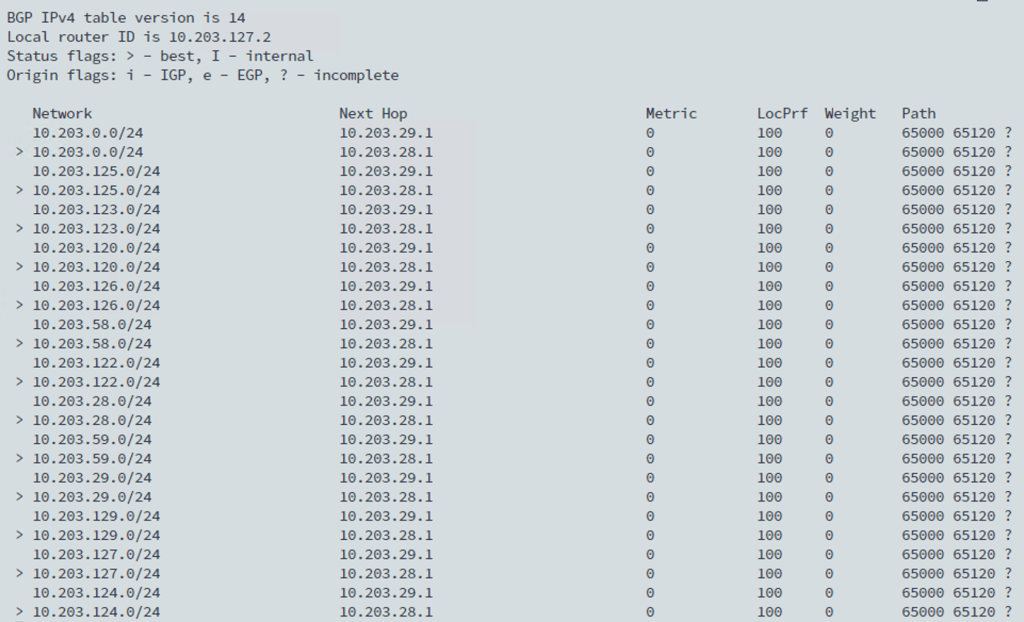
And the BGP routing table for this particular VRF:
get bgp ipv4
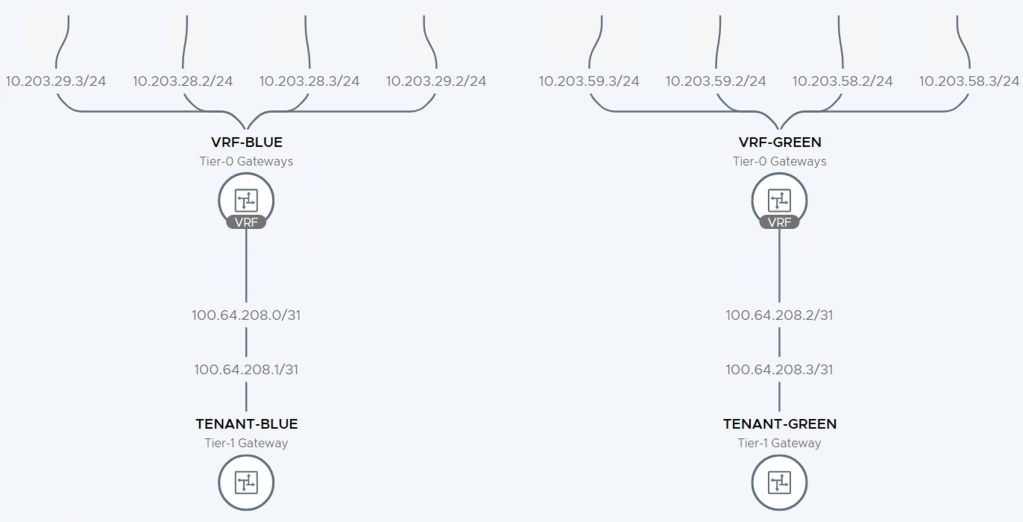
Inevitably, VRFs add some complexity to NSX-T Edge routing. I recommend using the Network Topology map in NSX Manager which is a pretty nice tool for keeping an overview of the routing configuration:
Summary
The new VRF Lite feature introduced in NSX-T 3.0 is a great addition to the platform. It gives customers scalable data plane isolation all the way into the physical network. VRF Lite is easy to set up and maintain and will definitely become the go-to configuration in NSX-T multitenancy environments.
Thanks for reading.