A stretched cluster architecture facilitates for higher levels of availability and things like inter-site load balancing. It’s a common multisite solution and also part of VMware’s Validated Design for SDDCs with multiple availability zones.
Traditionally compute networking in an active-active multisite setup has had its challenges, but with vSAN storage and NSX networking technologies that’s a thing of the past.
In the coming two articles I want to have a closer look at NSX-T in an active-active multisite environment. Specifically I want to learn more about how the different NSX-T components are deployed and how the data plane is configured in a stretched cluster.
In this first part I will deploy the NSX-T 2.5 platform and perform the necessary configurations and preparations so that in part two I can focus solely on the data plane (north-south and east-west).
This is going to be quite an exercise so let’s get right to it!
The lab environment
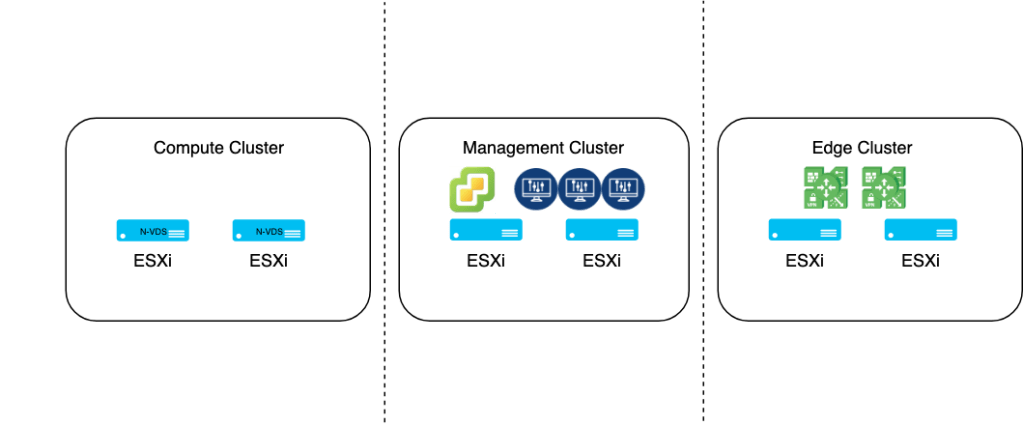
Below a high level overview of the lab environment as it looks right now:
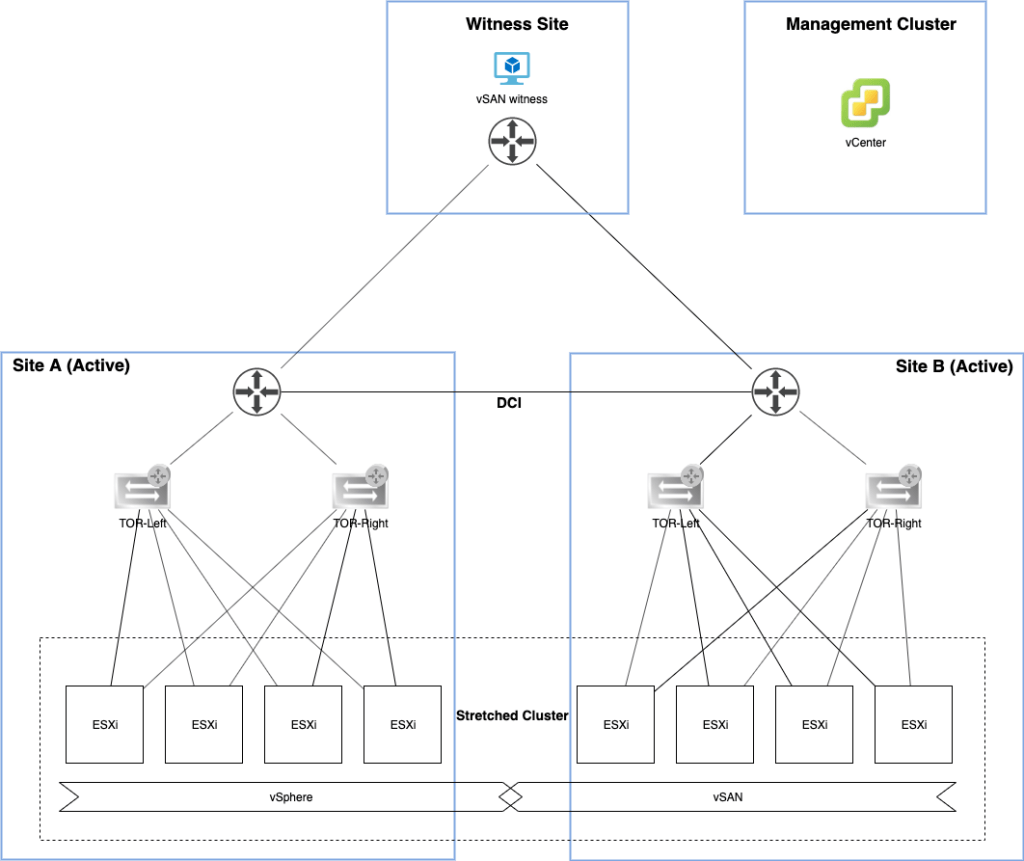
A vSAN cluster consisting of eight ESXi hosts stretched to a second site. A third site is hosting the vSAN witness appliance. A completely separate vSphere management cluster is only hosting the vCenter server right now.
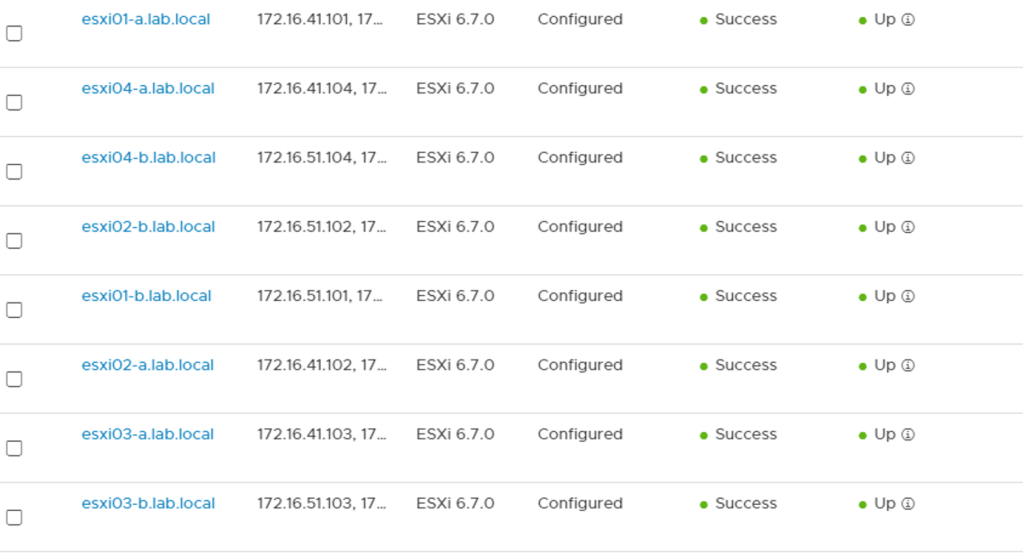
A quick look at the vSphere environment then. I’m running vSphere 6.7 U3:

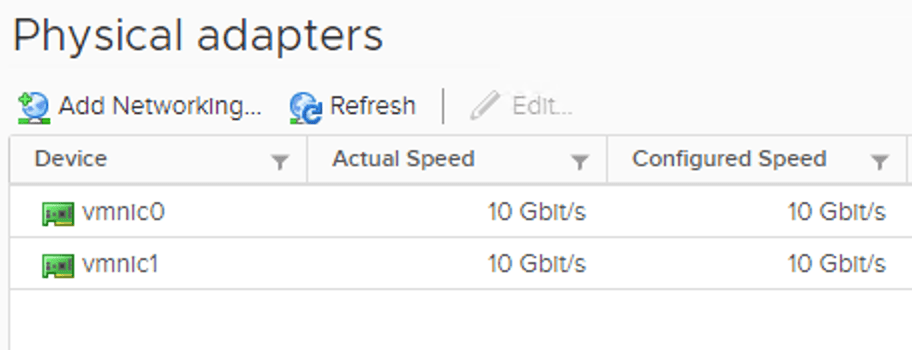
The hosts have two physical 10Gbit NICs:
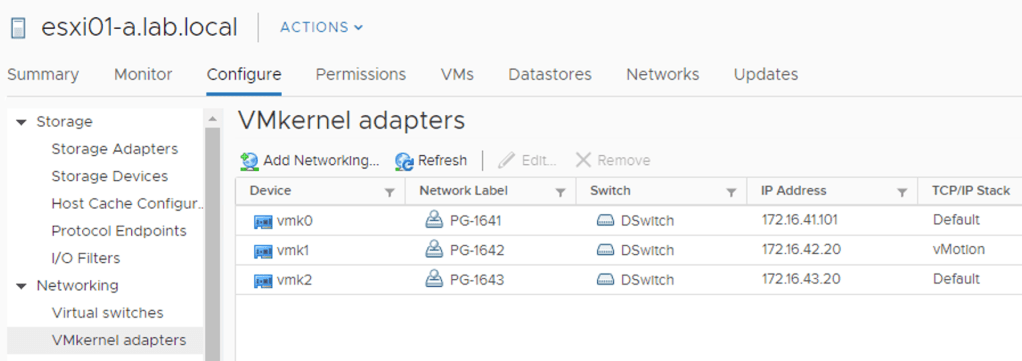
Three vmkernel adapters have been configured: Management, vMotion, and vSAN:
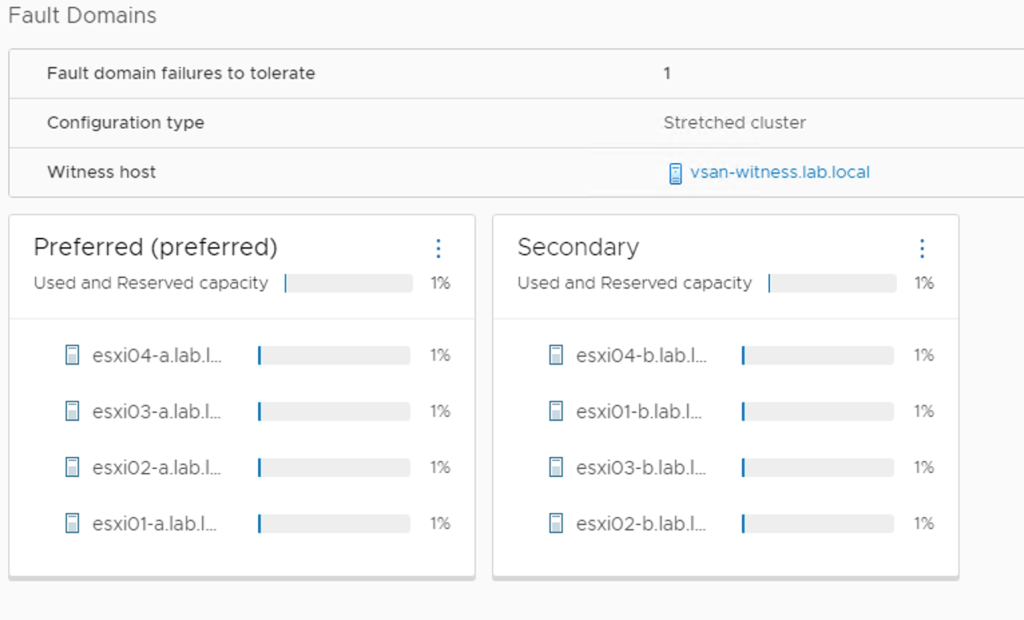
As mentioned, this is a vSAN stretched cluster:
The following tables list the VLANs and the associated IP subnets that are currently configured per site:
Site A:
| VLAN Function | VLAN ID | Subnet | Gateway |
|---|---|---|---|
| ESXi Management | 1641 | 172.16.41.0/24 | 172.16.41.253 |
| vMotion | 1642 | 172.16.42.0/24 | 172.16.42.253 |
| vSAN | 1643 | 172.16.43.0/24 | 172.16.43.253 |
Site B:
| VLAN Function | VLAN ID | Subnet | Gateway |
|---|---|---|---|
| ESXi Management | 1651 | 172.16.51.0/24 | 172.16.51.253 |
| vMotion | 1652 | 172.16.52.0/24 | 172.16.52.253 |
| vSAN | 1653 | 172.16.53.0/24 | 172.16.53.253 |
Witness Site:
| VLAN Function | VLAN ID | Subnet | Gateway |
|---|---|---|---|
| ESXi Management | 1711 | 172.17.11.0/24 | 172.17.11.253 |
| vSAN | 1713 | 172.17.13.0/24 | 172.17.13.253 |
Management Cluster:
| VLAN Function | VLAN ID | Subnet | Gateway |
|---|---|---|---|
| SDDC Management | 1611 | 172.16.11.0/24 | 172.16.11.253 |
NSX-T is not deployed yet, but that’s about to change pretty soon 😉
Deploying the NSX-T manager cluster
Installing NSX-T 2.5 always starts with deploying the manager cluster. It consists of three manager nodes and an optional virtual IP (VIP).
I will deploy the NSX manager cluster nodes in the vSphere management cluster and connect them to the SDDC Management VLAN (1611).
The IP plan for the NSX manager cluster looks like this:
| Hostname | IP Address |
|---|---|
| nsxmanager01 | 172.16.11.82 |
| nsxmanager02 | 172.16.11.83 |
| nsxmanager03 | 172.16.11.84 |
| nsxmanager | 172.16.11.81 (virtual IP) |
First manager node
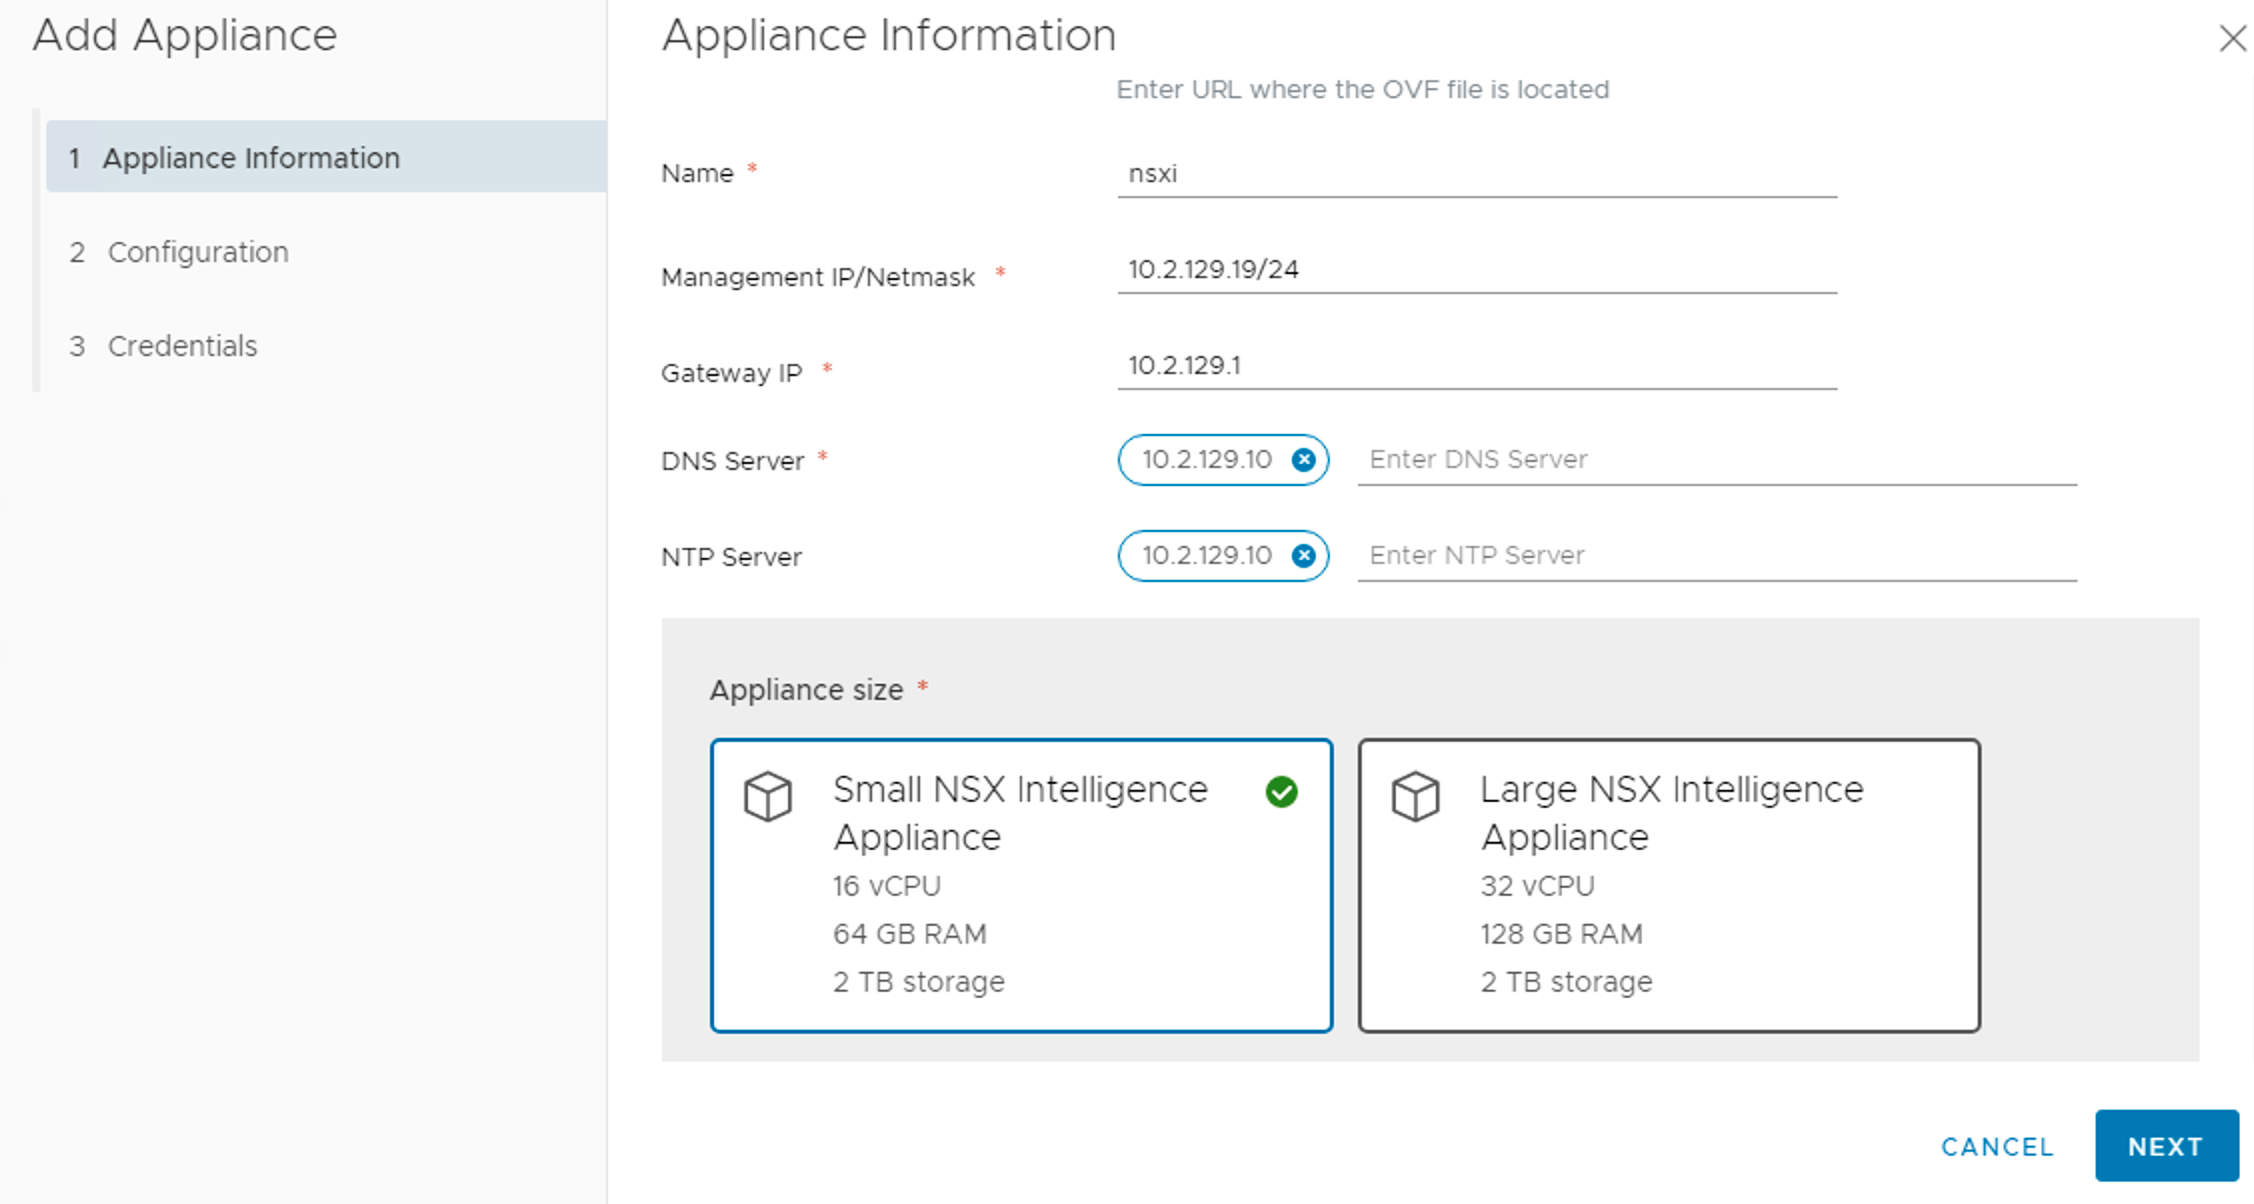
I deploy the first manager node from the OVA package:
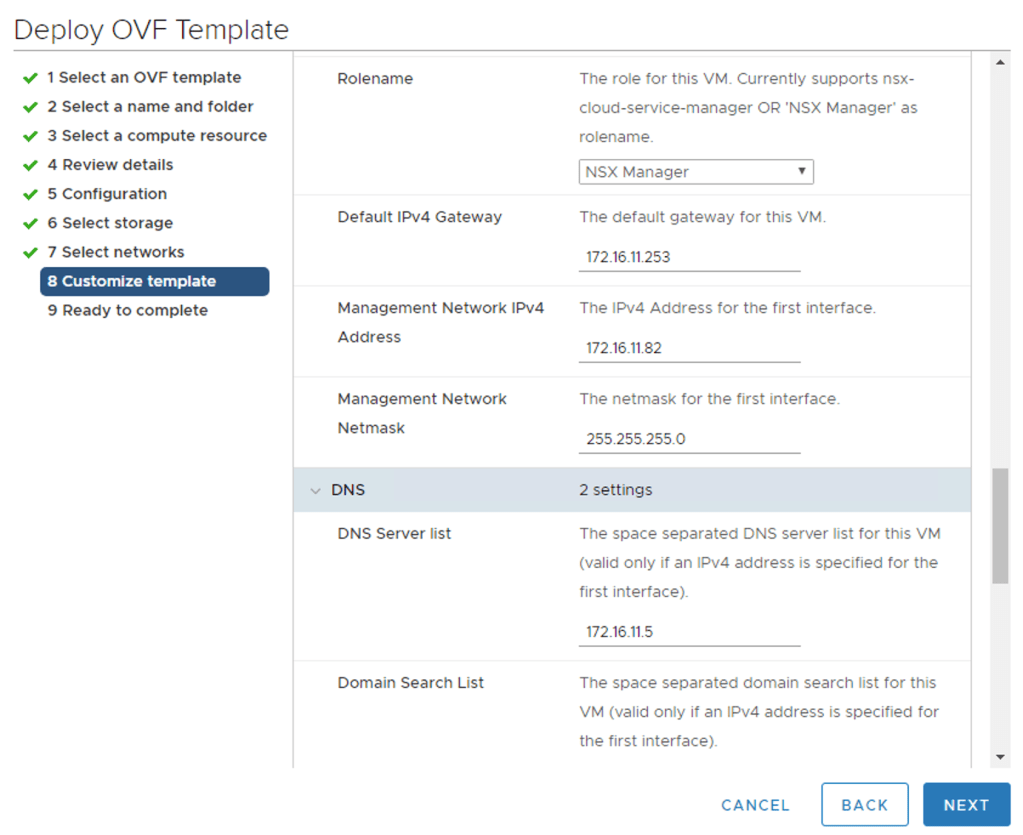
Filling out the configuration details and then kicking off the deployment.
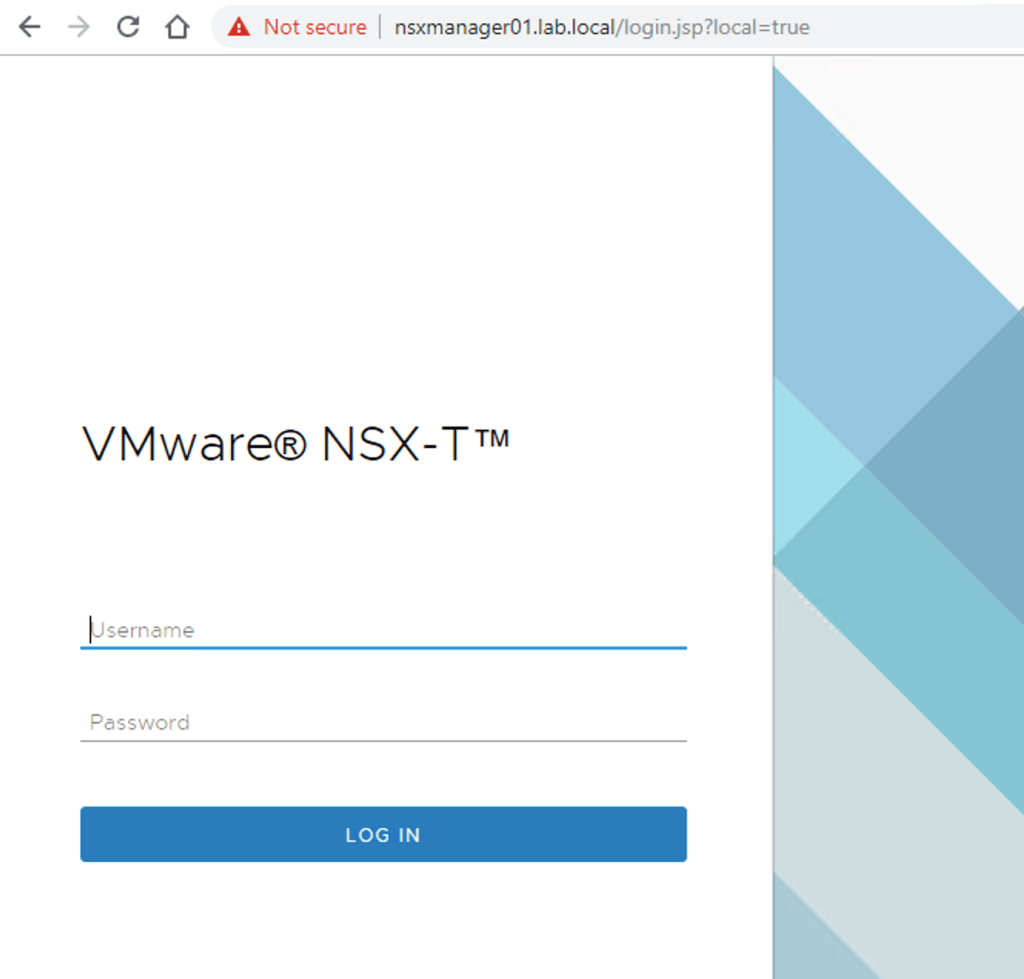
When the first manager node is up and running I’m logging in to the NSX Manager UI:
Second and third manager nodes
The second and third manager nodes can be deployed from the NSX Manager UI. Before I can do that I need to add my vCenter server under System > Fabric > Compute Manager:
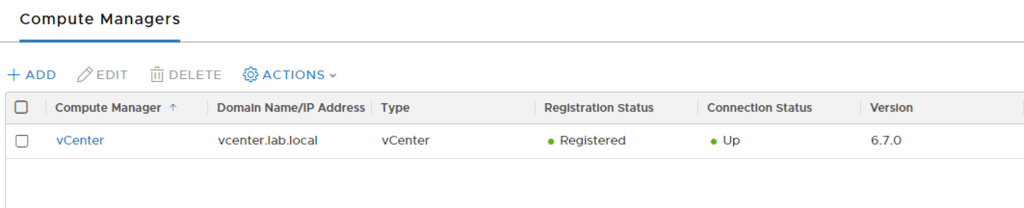
Now I’m able to deploy the second and third manager nodes via System > Appliances > Add Nodes.
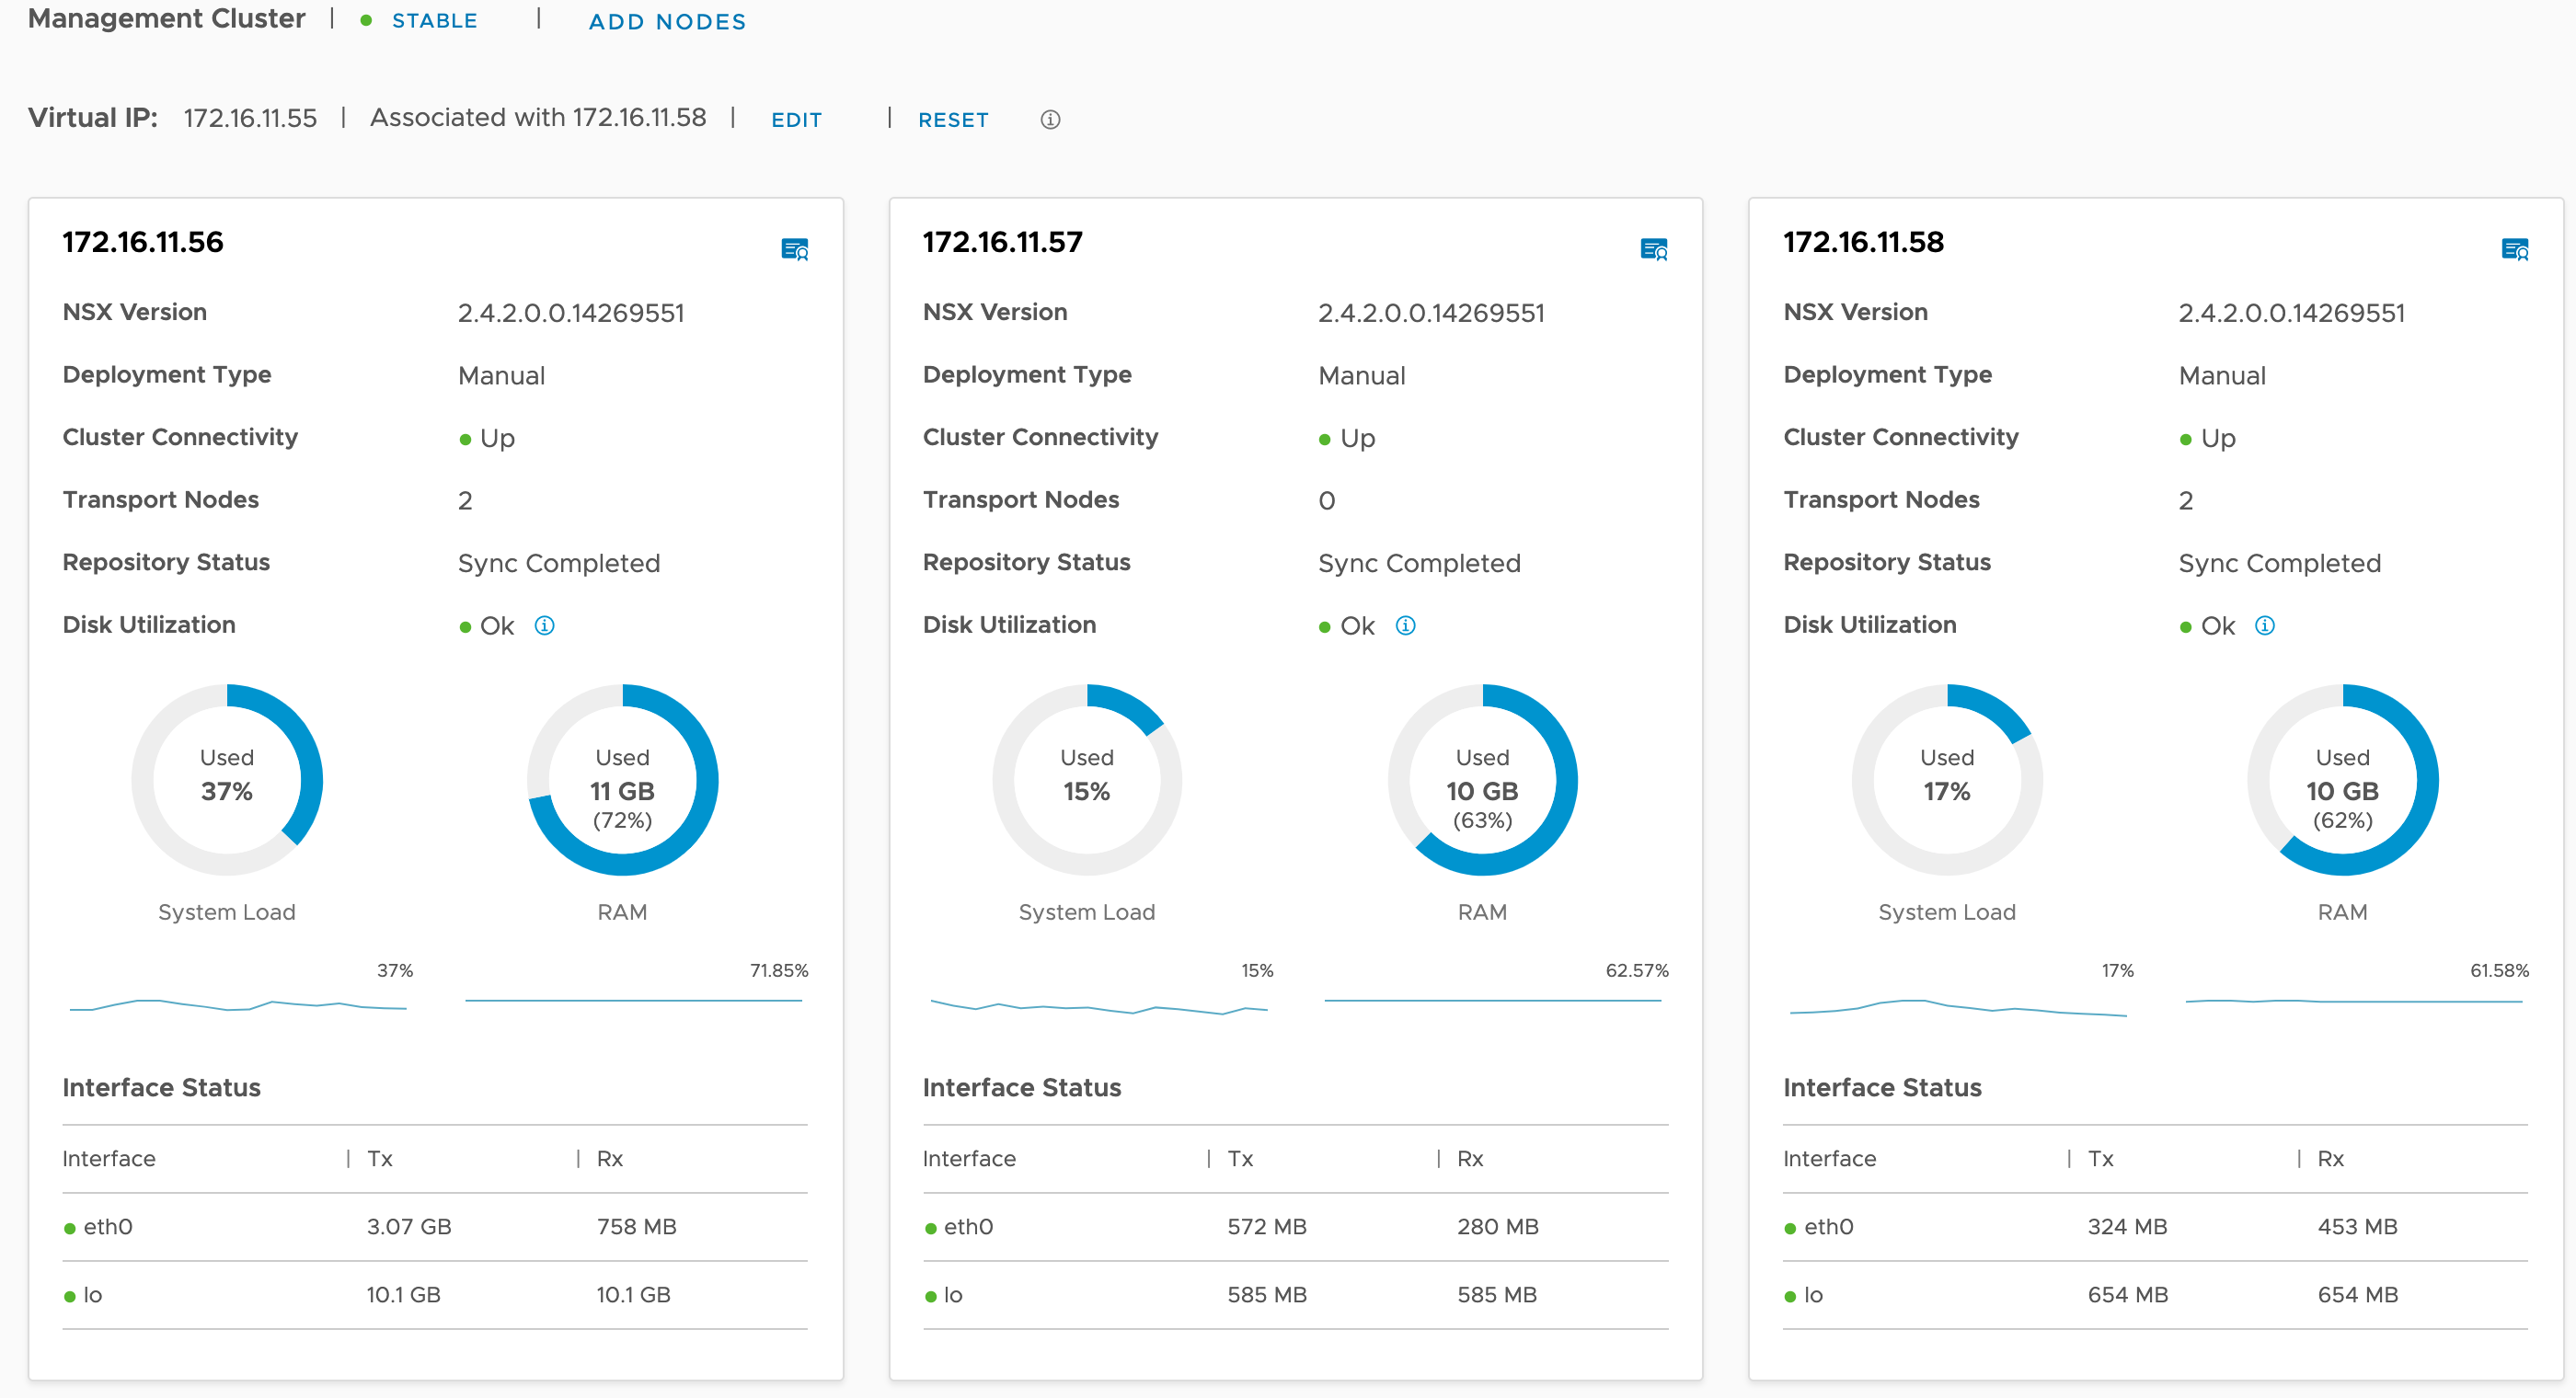
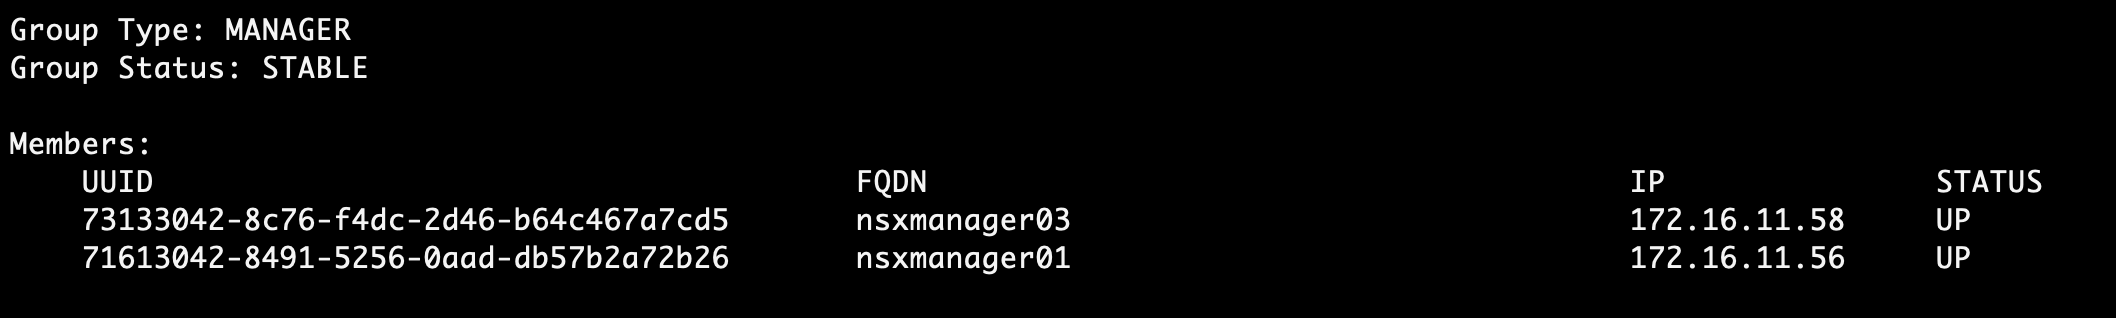
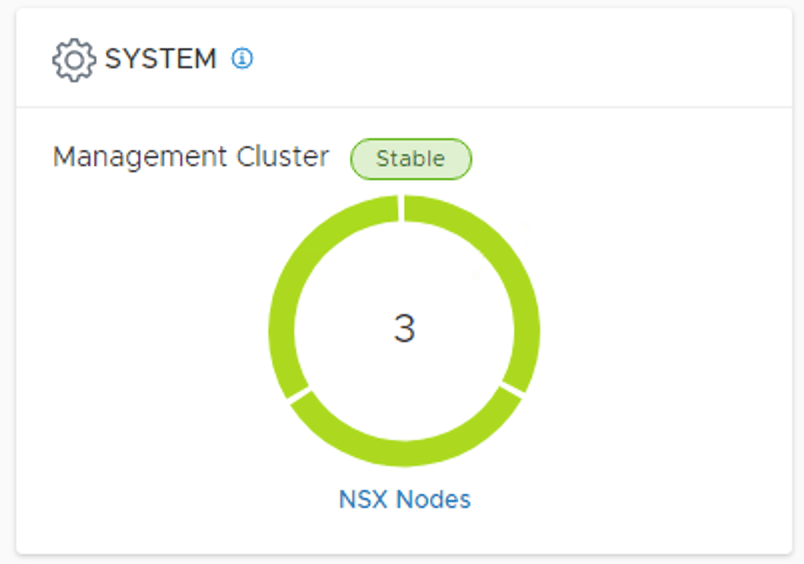
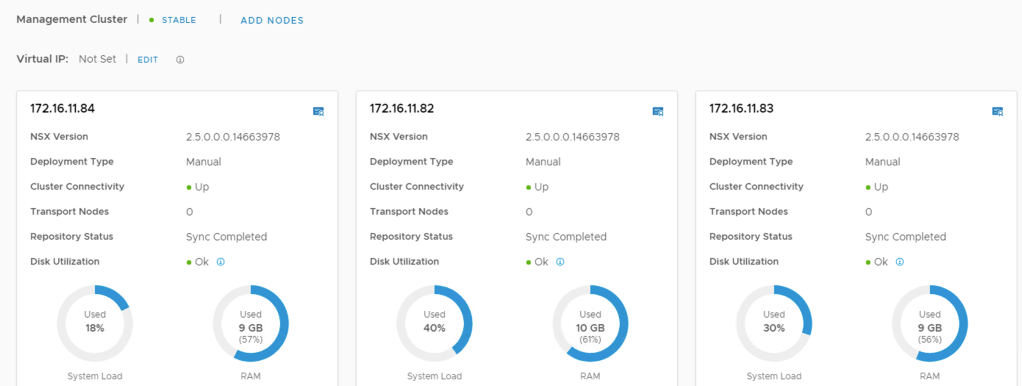
Once done the three nodes are shown in the UI and the cluster connectivity is up:
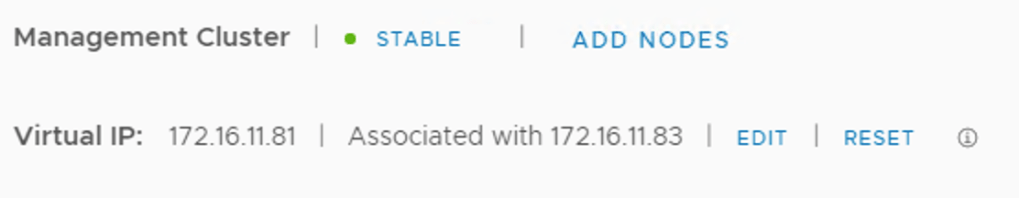
Assign virtual IP address
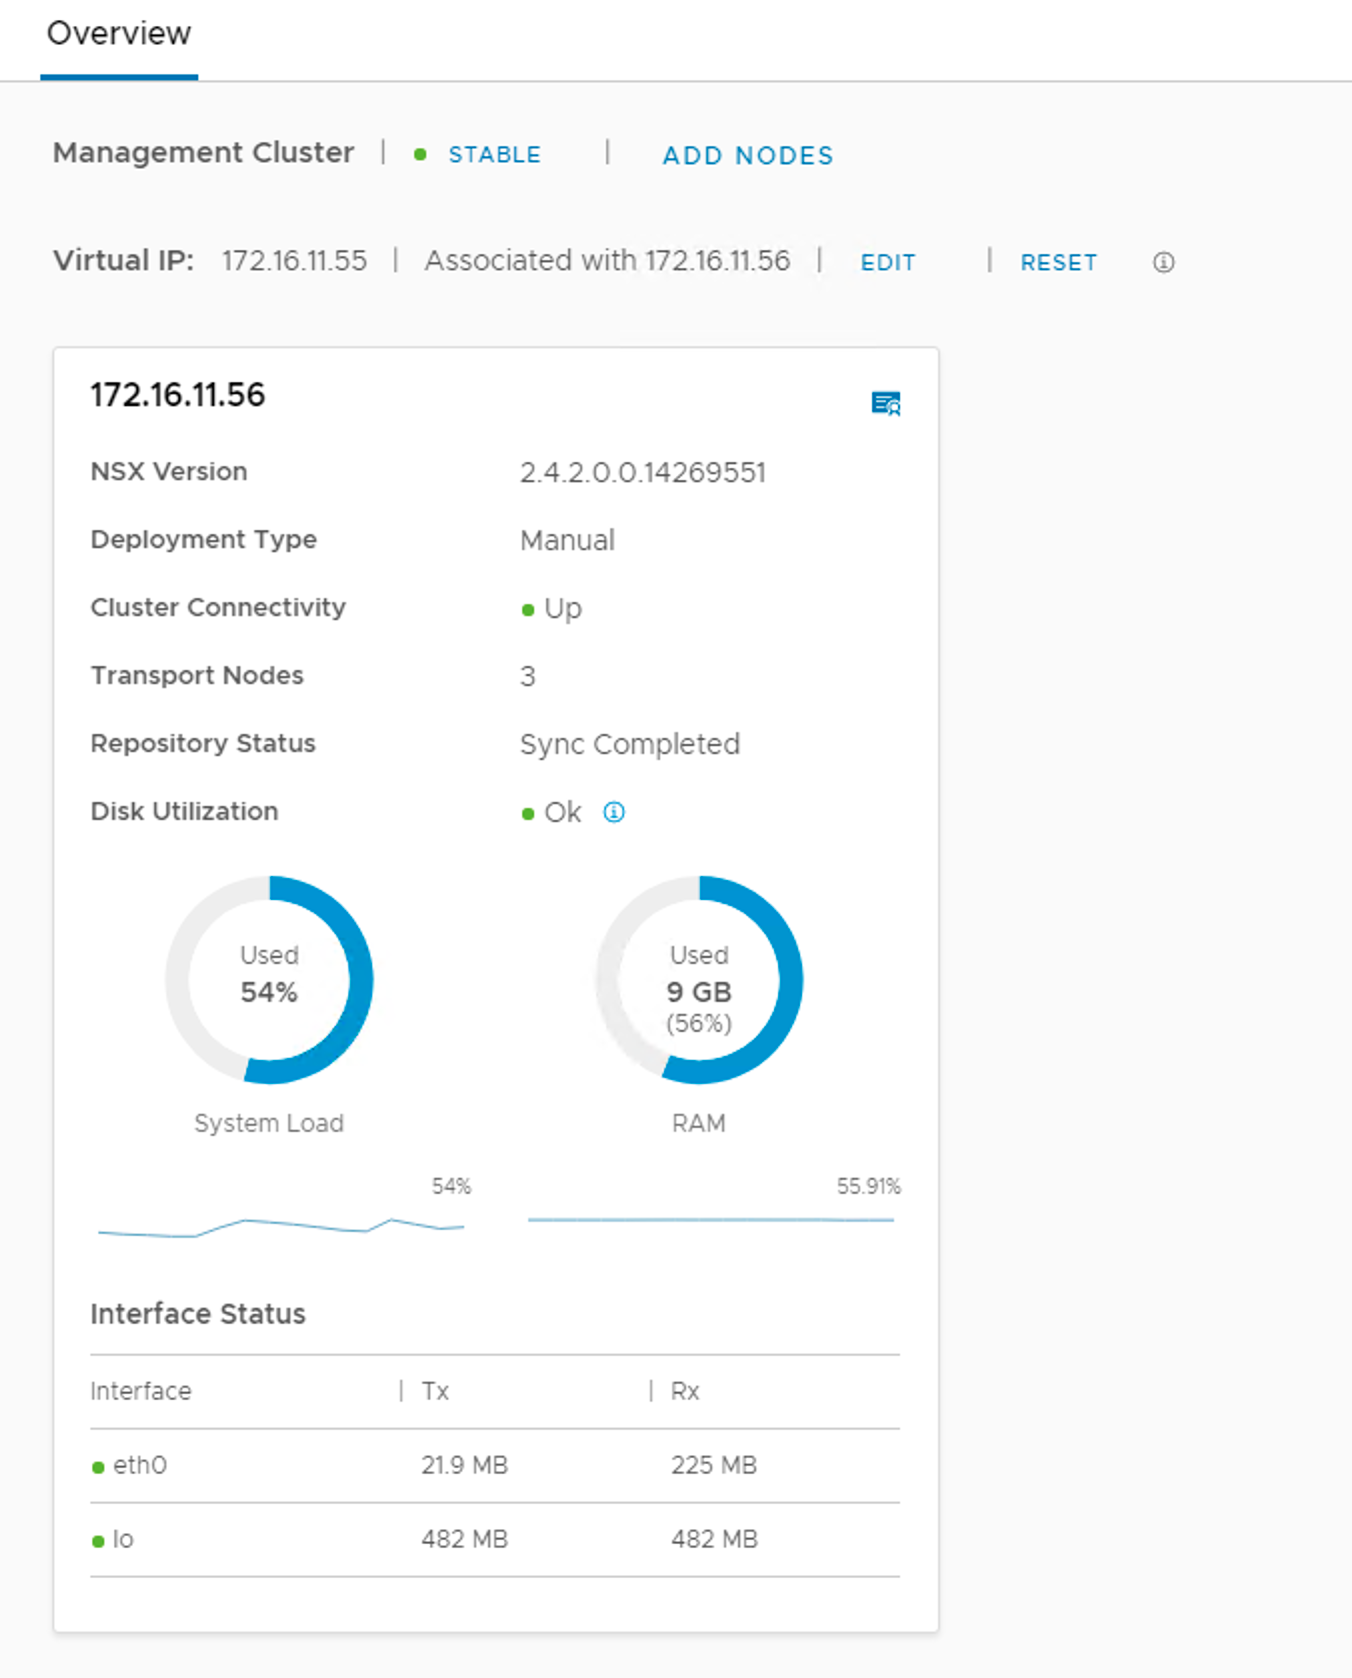
I finalize the manager cluster deployment by configuring a virtual IP address. This is done under System > Appliances > Virtual IP:
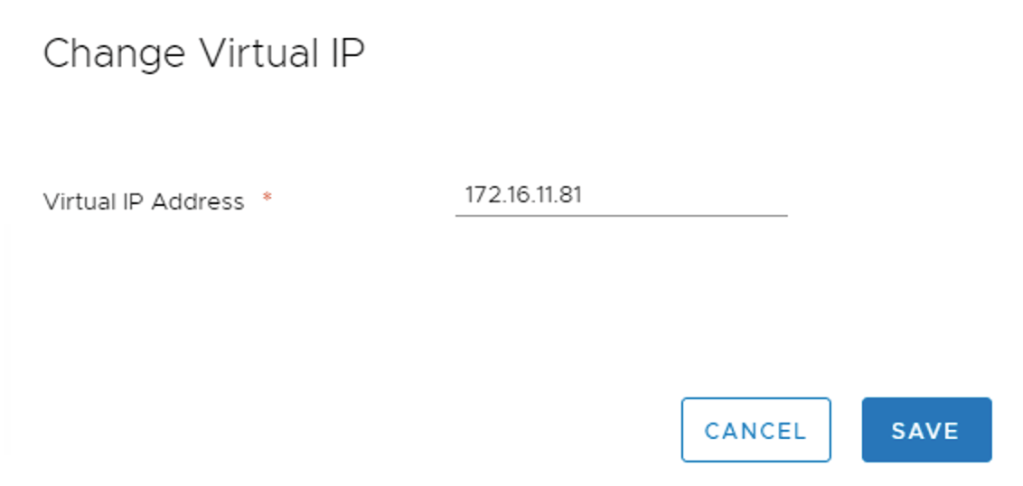
A couple of minutes later the virtual IP is active:
Configuring the NSX-T data plane
Now that the NSX-T management plane is fully operational I will continue with the data plane preparations and configurations.
More VLANs
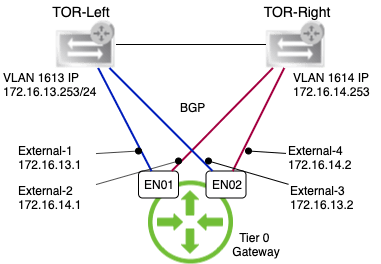
First I need to provision some more VLANs in the TORs at the data sites. At each site I need two VLANs for overlay and another two for connecting NSX with the physical network later on:
Site A:
| VLAN Function | VLAN ID | Subnet | Gateway |
|---|---|---|---|
| Host overlay | 1644 | 172.16.44.0/24 | 172.16.44.253 |
| Uplink01 | 1647 | 172.16.47.0/24 | 172.16.47.253 |
| Uplink02 | 1648 | 172.16.48.0/24 | 172.16.48.253 |
| Edge overlay | 1649 | 172.16.49.0/24 | 172.16.49.253 |
Site B:
| VLAN Function | VLAN ID | Subnet | Gateway |
|---|---|---|---|
| Host overlay | 1654 | 172.16.54.0/24 | 172.16.54.253 |
| Uplink01 | 1657 | 172.16.57.0/24 | 172.16.57.253 |
| Uplink02 | 1658 | 172.16.58.0/24 | 172.16.58.253 |
| Edge overlay | 1659 | 172.16.59.0/24 | 172.16.59.253 |
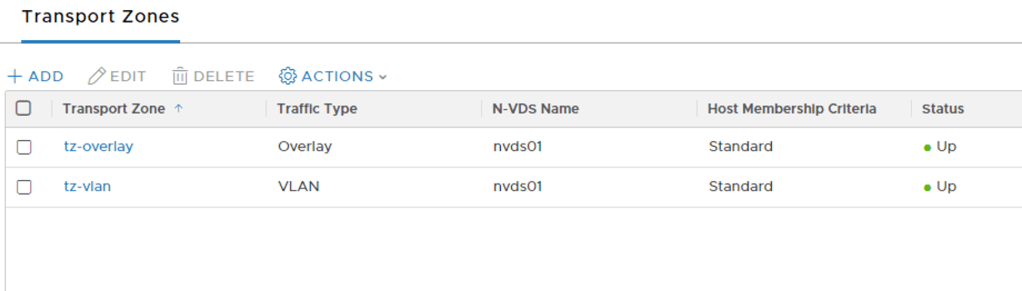
Transport zones
Two transport zones should do it I believe. I create them using the following details:
| Name | N-VDS Name | Traffic Type |
|---|---|---|
| tz-vlan | nvds01 | VLAN |
| tz-overlay | nvds01 | Overlay |
Transport zones are managed under System > Fabric > Transport Zones:
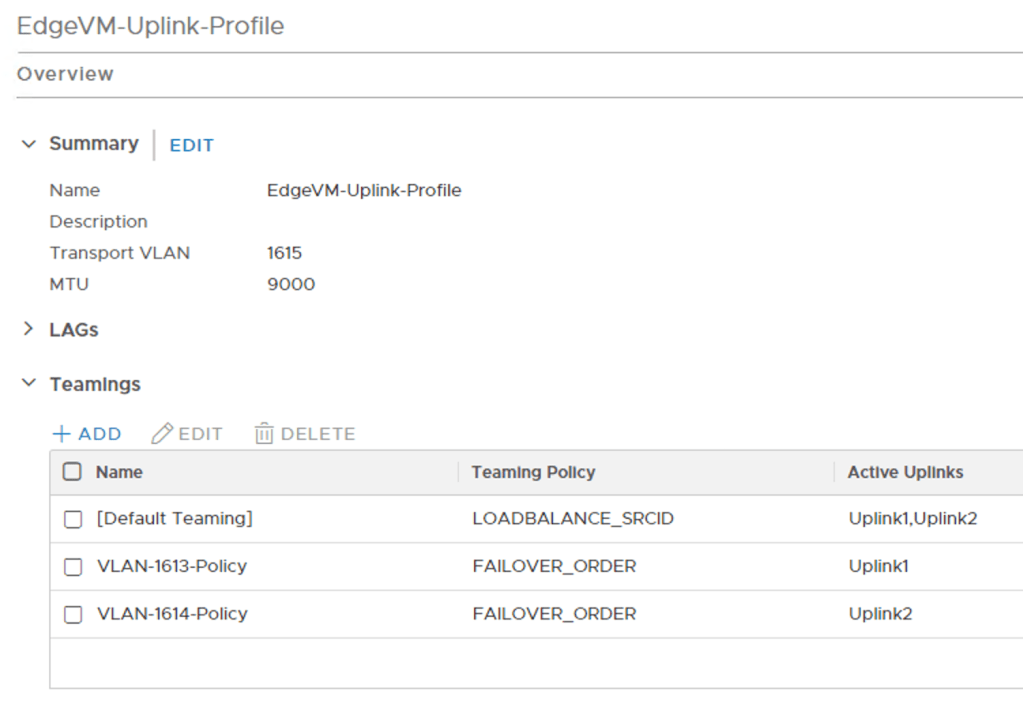
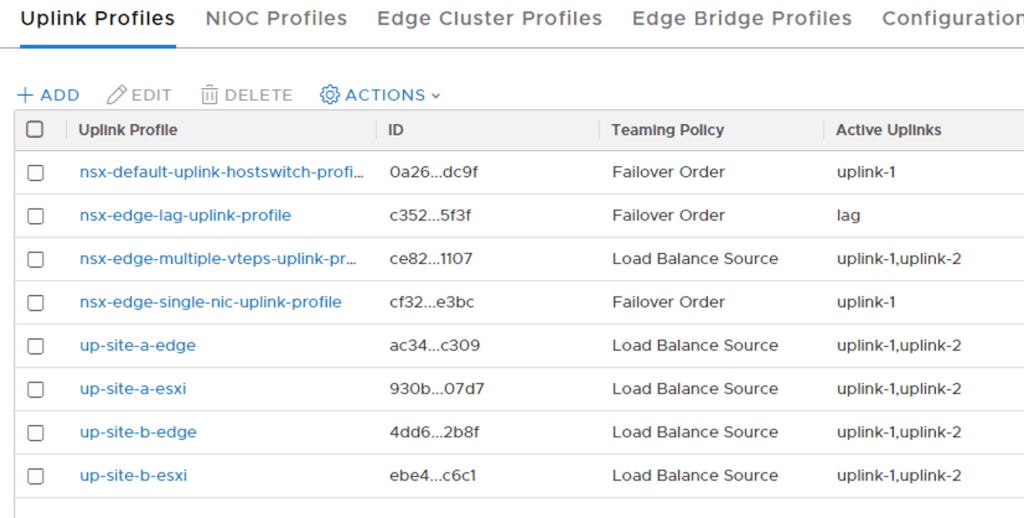
Uplink profiles
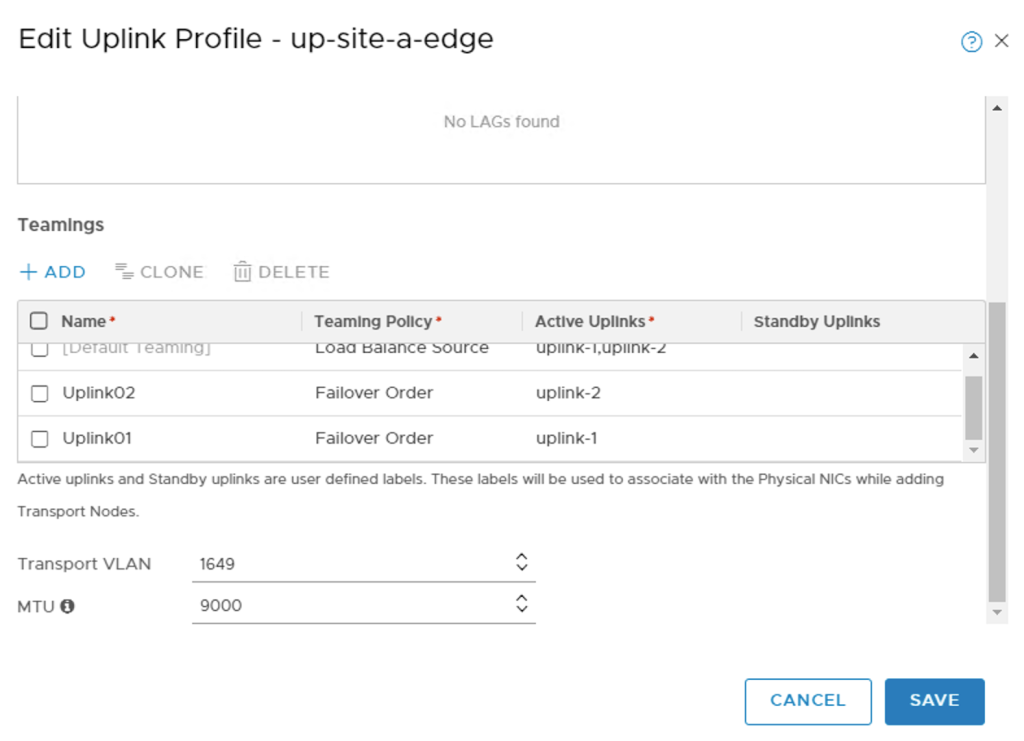
Next, I need to create four uplink profiles. The table below shows the configuration details for each of them:
| Name | Teaming Policy | Active Uplinks | Transport VLAN | MTU |
|---|---|---|---|---|
| up-site-a-esxi | Load Balance Source | uplink-1, uplink-2 | 1644 | 9000 |
| up-site-a-edge | Load Balance Source | uplink-1, uplink-2 | 1649 | 9000 |
| up-site-b-esxi | Load Balance Source | uplink-1, uplink-2 | 1654 | 9000 |
| up-site-b-edge | Load Balance Source | uplink-1, uplink-2 | 1659 | 9000 |
Uplink profiles are managed under System > Fabric > Profiles > Uplink Profiles:
In order to achieve VLAN pinning, deterministic routing, and ECMP I need to add two named teaming policies to the uplink profiles that I just created:
| Name | Teaming Policy | Active Uplinks |
|---|---|---|
| Uplink01 | Failover Order | uplink-1 |
| Uplink02 | Failover Order | uplink-2 |
Adding the named teaming policies to the uplink profiles:
I also need to add the Uplink01 and Uplink02 named teaming policies to transport zone tz-vlan. This so that they can be selected on segments belonging to that transport zone later on:

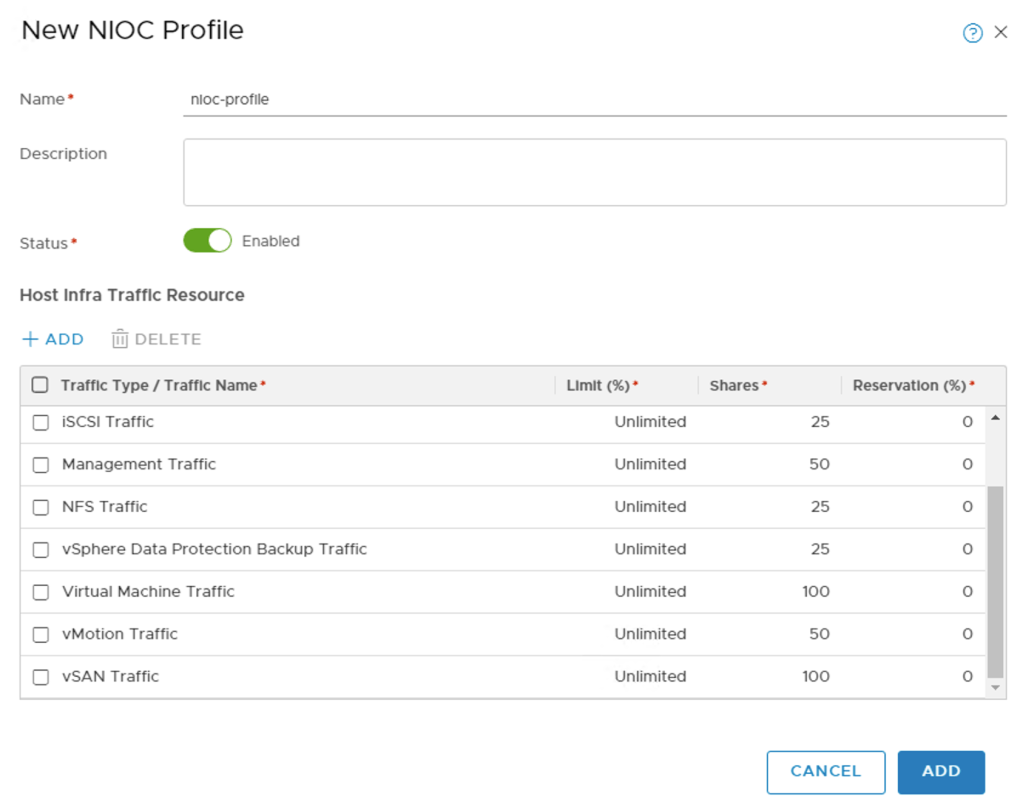
Network I/O Control profile
To allocate bandwidth to different types of network traffic I create a network I/O control profile. After long and hard thinking I decided to call it nioc-profile and it has the following settings:
| Traffic Type / Traffic Name | Shares |
|---|---|
| Fault Tolerance (FT) Traffic | 25 |
| vSphere Replication (VR) Traffic | 25 |
| iSCSI Traffic | 25 |
| Management Traffic | 50 |
| NFS Traffic | 25 |
| vSphere Data Protection Backup Traffic | 25 |
| Virtual Machine Traffic | 100 |
| vMotion Traffic | 25 |
| vSAN Traffic | 100 |
Network I/O control profiles are managed under System > Fabric > Profiles > NIOC Profiles:
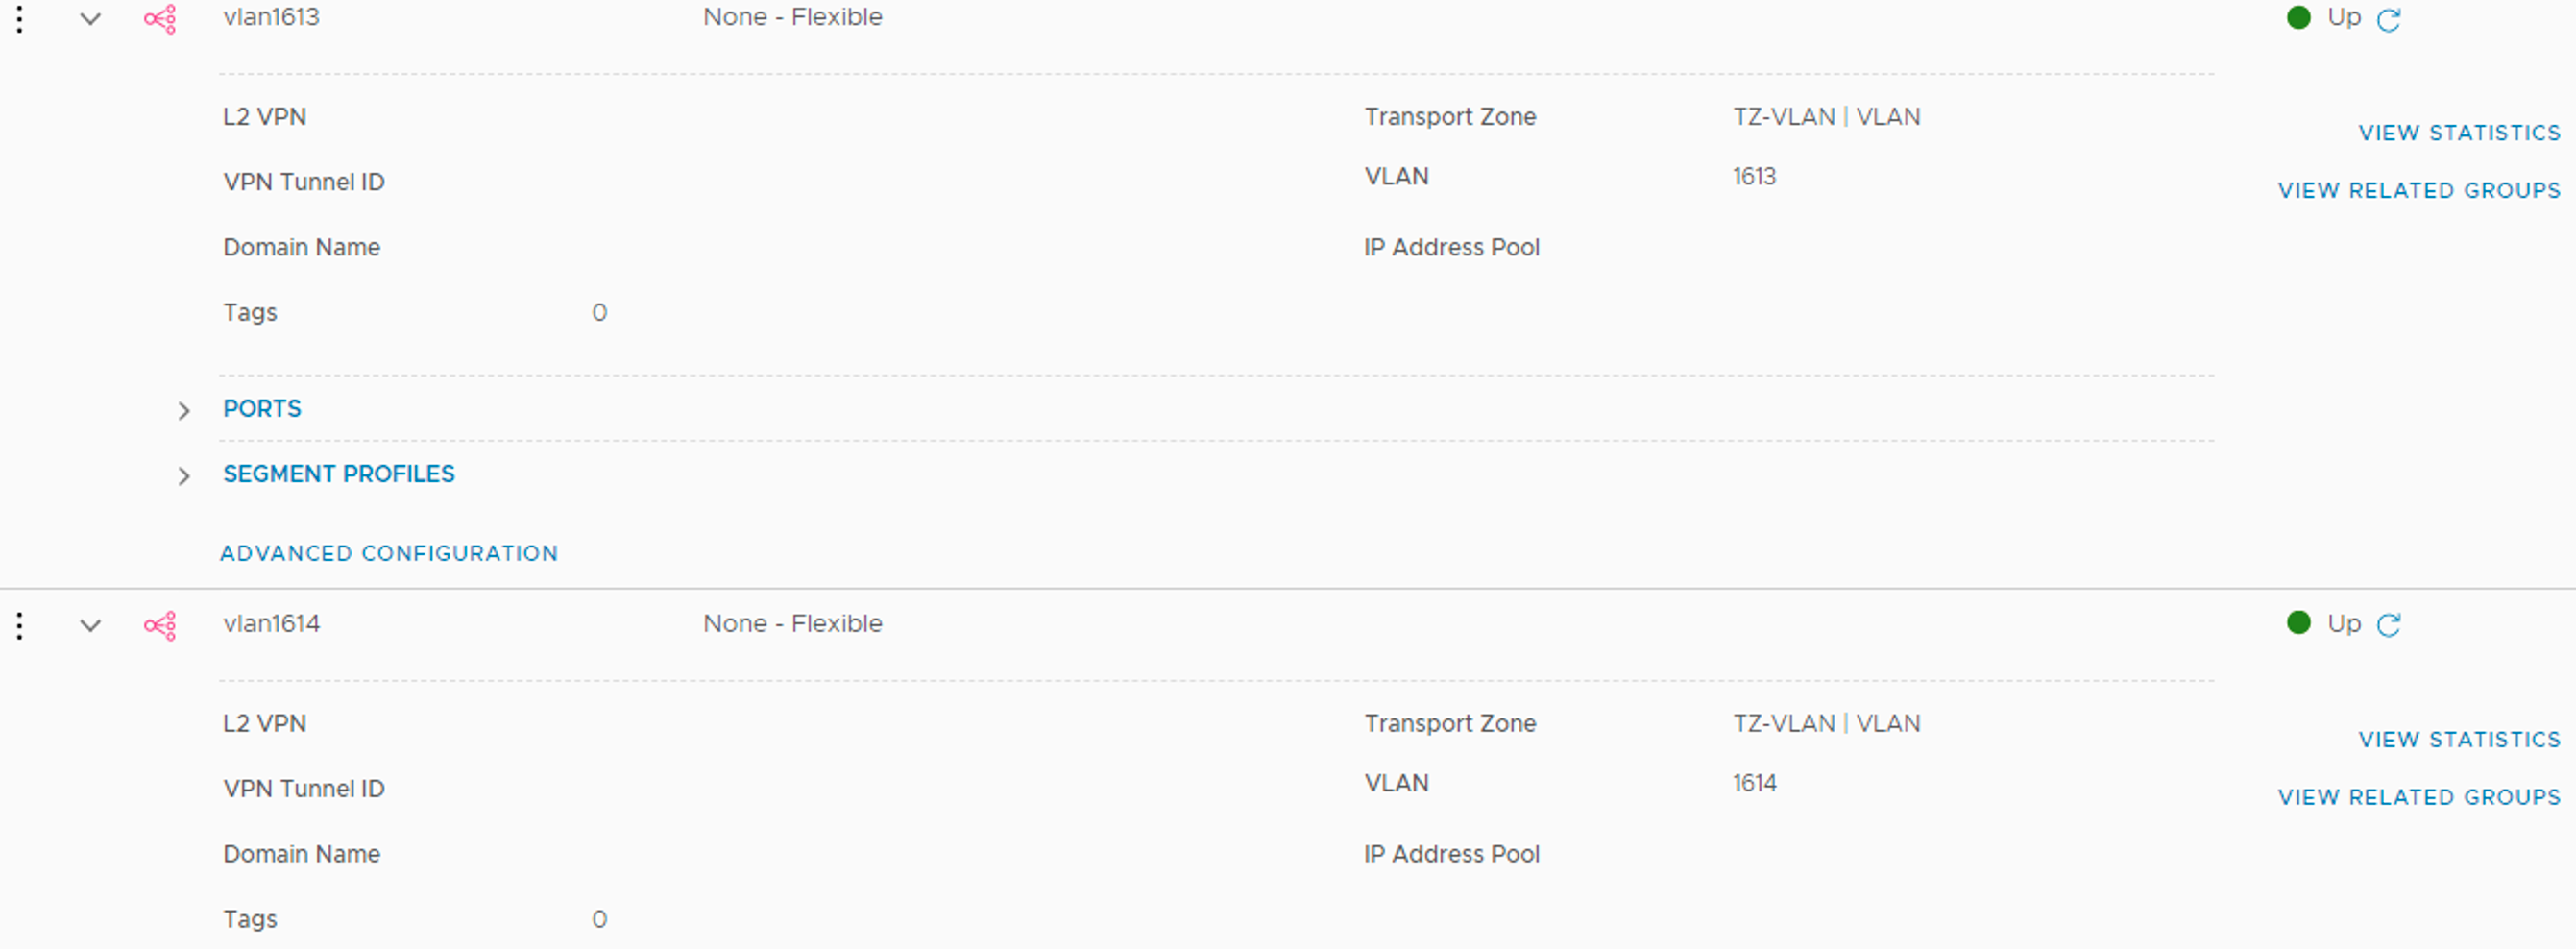
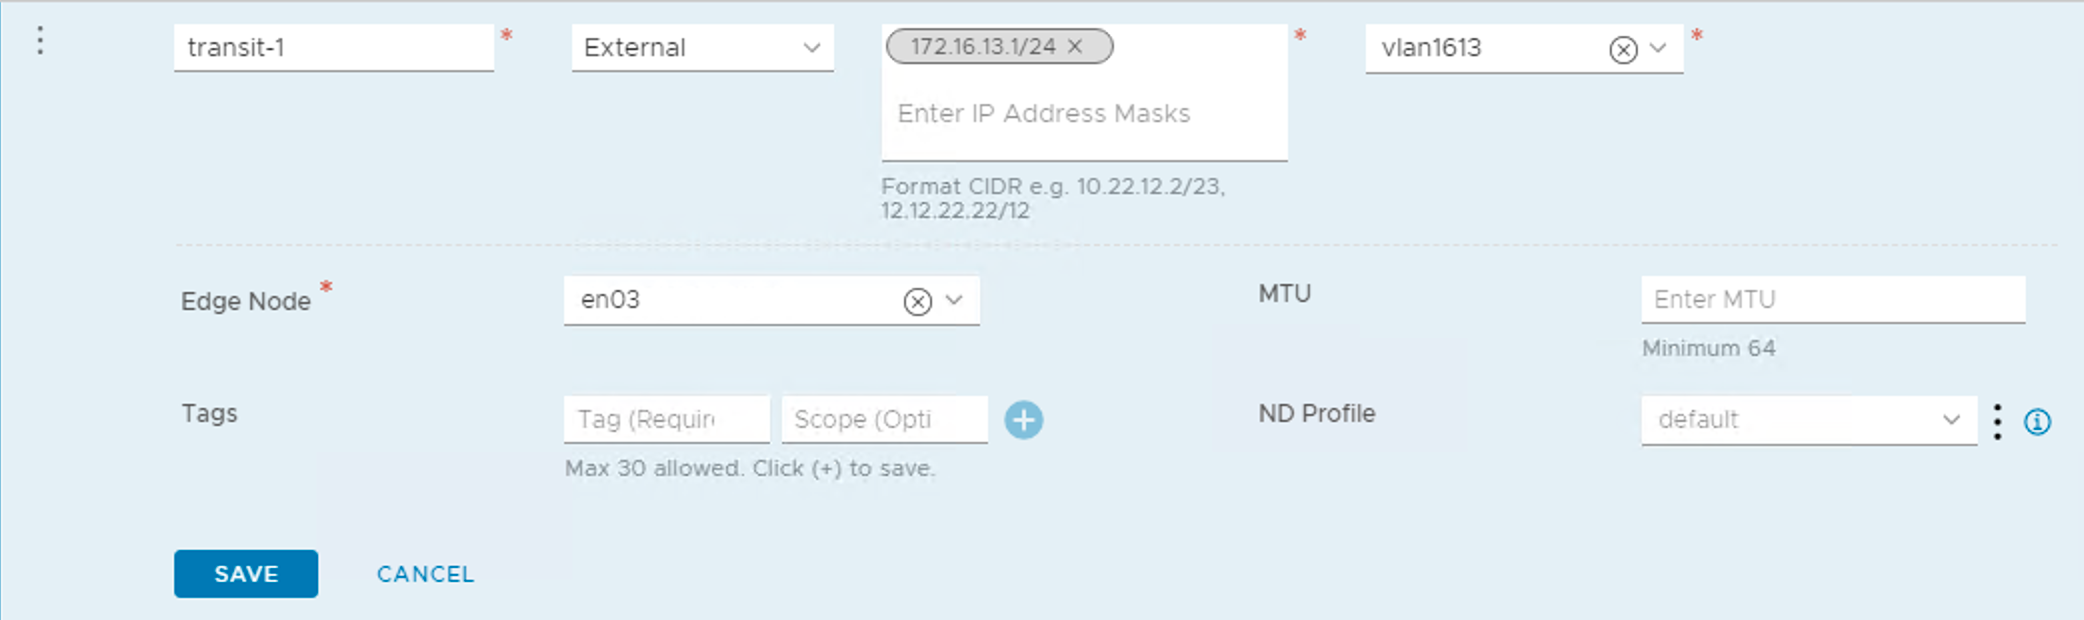
Segments
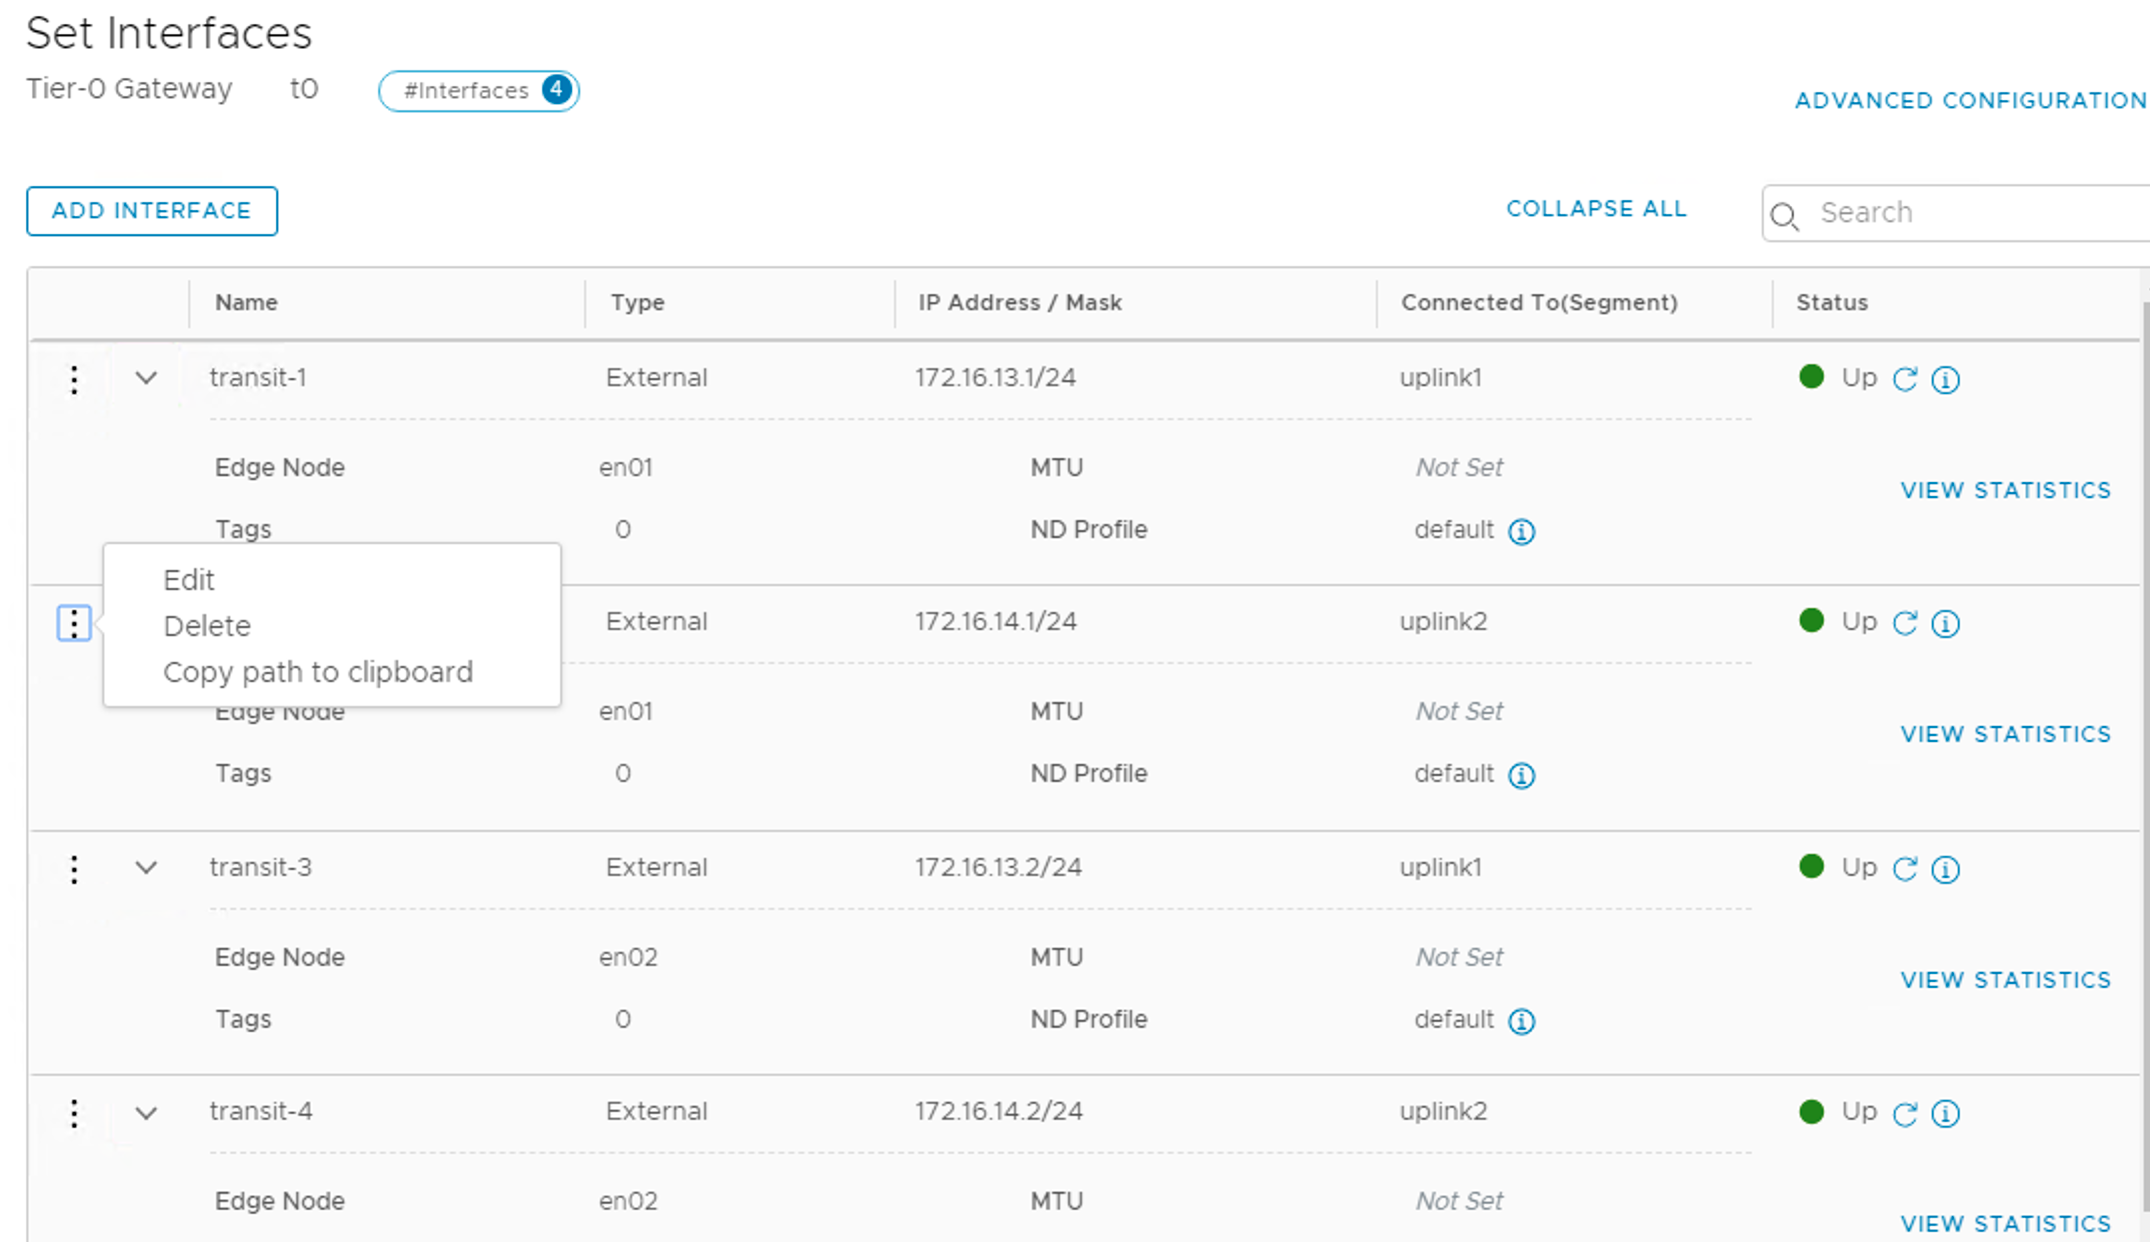
VLAN-backed segments are needed for system, uplink/transit, and overlay traffic. The table below lists the segments with their settings that I will create:
| Segment Name | Uplink & Type | Transport Zone | VLAN |
|---|---|---|---|
| site-a-nvds01-management | none | tz-vlan | 1641 |
| site-a-nvds01-vmotion | none | tz-vlan | 1642 |
| site-a-nvds01-vsan | none | tz-vlan | 1643 |
| site-a-edge-transit01 | none | tz-vlan | 1647 |
| site-a-edge-transit02 | none | tz-vlan | 1648 |
| site-b-nvds01-management | none | tz-vlan | 1651 |
| site-b-nvds01-vmotion | none | tz-vlan | 1652 |
| site-b-nvds01-vsan | none | tz-vlan | 1653 |
| site-b-edge-transit01 | none | tz-vlan | 1657 |
| site-b-edge-transit02 | none | tz-vlan | 1658 |
| edge-uplink1 | none | tz-vlan | 0-4094 |
| edge-uplink2 | none | tz-vlan | 0-4094 |
Segments are managed under Networking > Connectivity > Segments:

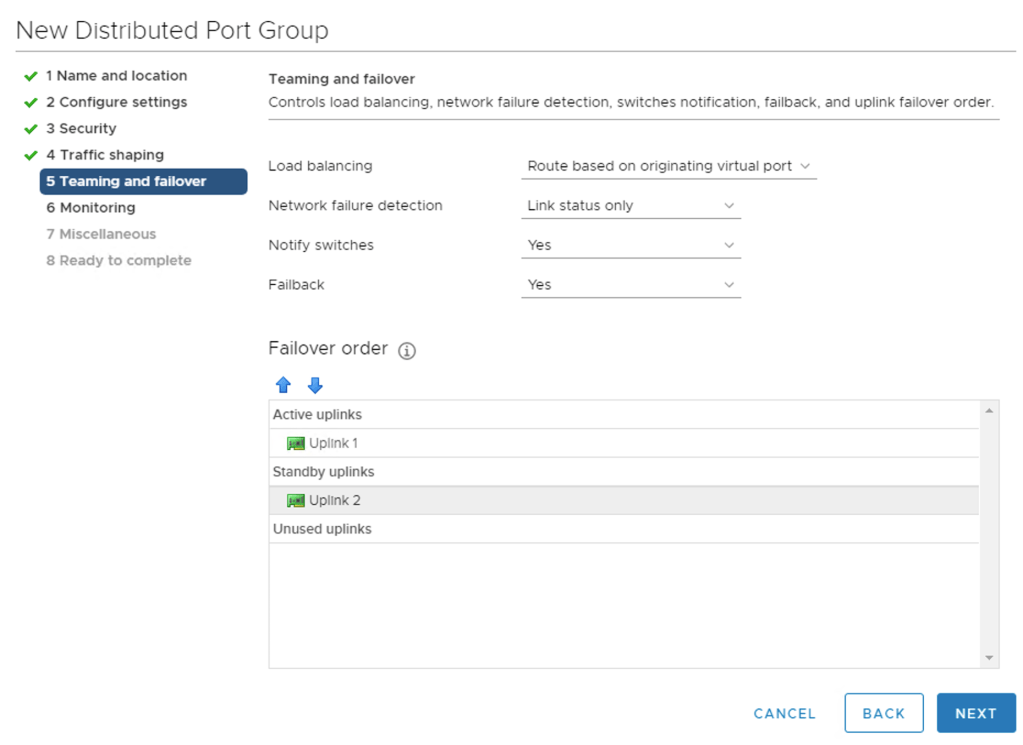
Uplink teaming policy
The uplink teaming policy for segments edge-uplink1 and edge-uplink2 need to be modified so that the named teaming policies Uplink01 and Uplink02 are used instead of the default.
For this I have to edit these segments under Advanced Networking & Security > Networking > Switching:

Configure ESXi hosts
Now the time has come to configure the ESXi hosts and turn them into NSX-T transport nodes!
In the NSX Manager UI I navigate to System > Fabric > Nodes and change the “Managed by” to my vCenter server. The ESXi hosts are listed:
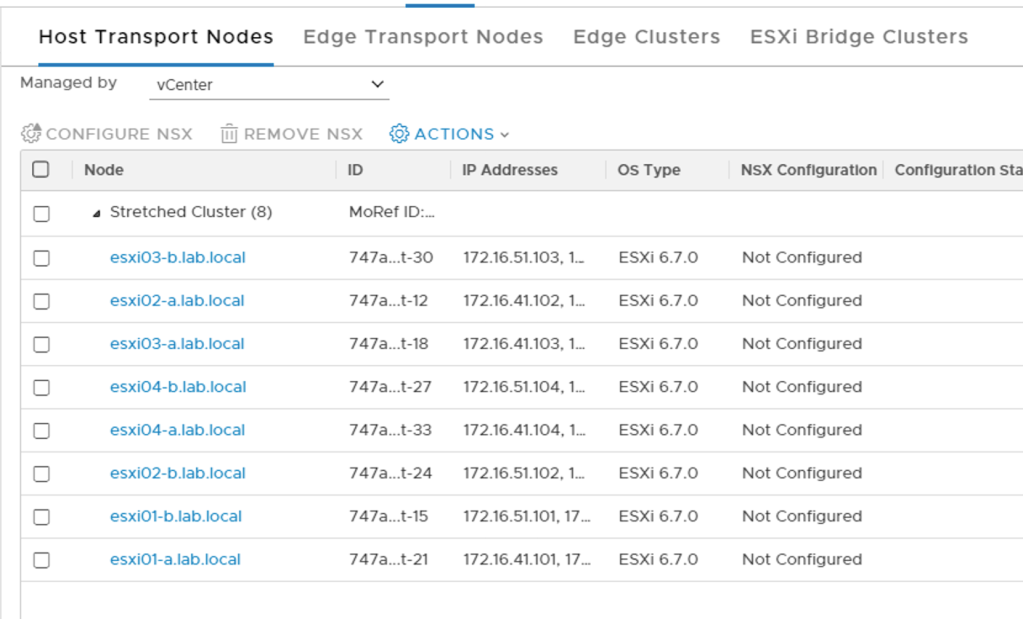
Unfortunately, I can’t make use of a transport node profiles here as these are assigned at the vSphere cluster level. I will therefore configure my hosts one at a time.
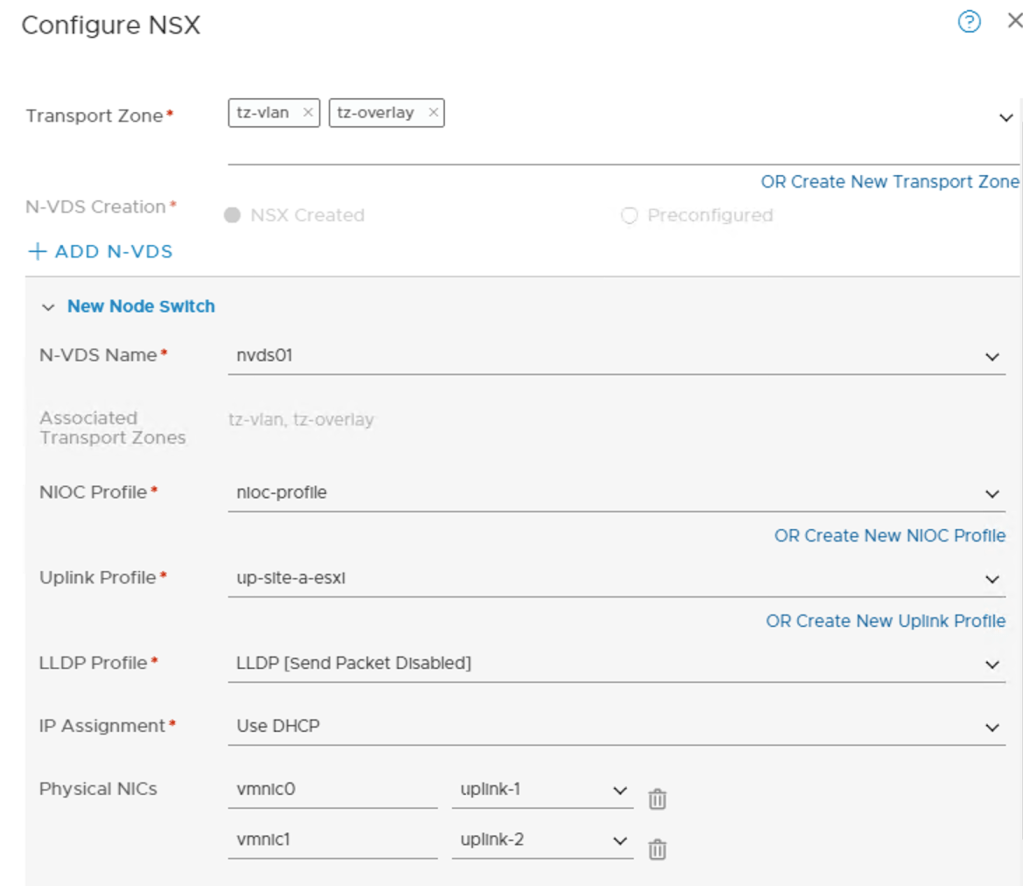
The ESXi transport nodes in Site A will be configured with the following settings:
| Setting | Values |
|---|---|
| Transport Zone | tz-vlan, tz-overlay |
| N-VDS Name | nvds01 |
| NIOC Profile | nioc-profile |
| Uplink Profile | up-site-a-esxi |
| LLDP Profile | LLDP [Send Packet Disabled] |
| IP Assignment | Use DHCP |
| Physical NICS | vmnic0 – uplink-1 vmnic1 – uplink-2 |
| vmk0 | site-a-nvds01-management |
| vmk1 | site-a-nvds01-vmotion |
| vmk2 | site-a-nvds01-vsan |
ESXi transport nodes in Site B use slightly different settings:
| Setting | Values |
|---|---|
| Transport Zone | tz-vlan, tz-overlay |
| N-VDS Name | nvds01 |
| NIOC Profile | nioc-profile |
| Uplink Profile | up-site-b-esxi |
| LLDP Profile | LLDP [Send Packet Disabled] |
| IP Assignment | Use DHCP |
| Physical NICS | vmnic0 – uplink-1 vmnic1 – uplink-2 |
| vmk0 | site-b-nvds01-management |
| vmk1 | site-b-nvds01-vmotion |
| vmk2 | site-b-nvds01-vsan |
Selecting one host at a time clicking Configure NSX:
The network mappings for install for vmkernel adapter migration:
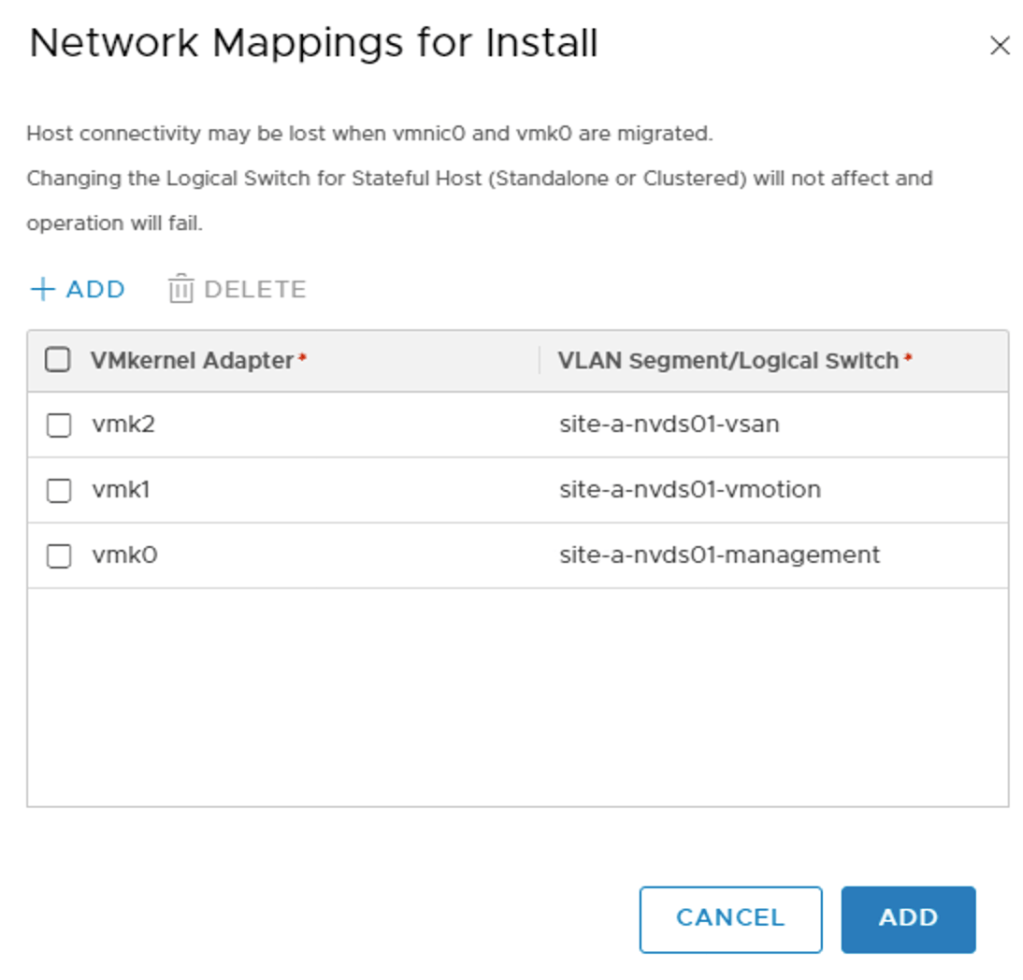
When I click Finish the NSX installation and configuration process starts on the selected ESXi host. NSX bits are installed, the host receives the N-VDS, and the vmkernel adapters are migrated from VDS port groups to the N-VDS segments.
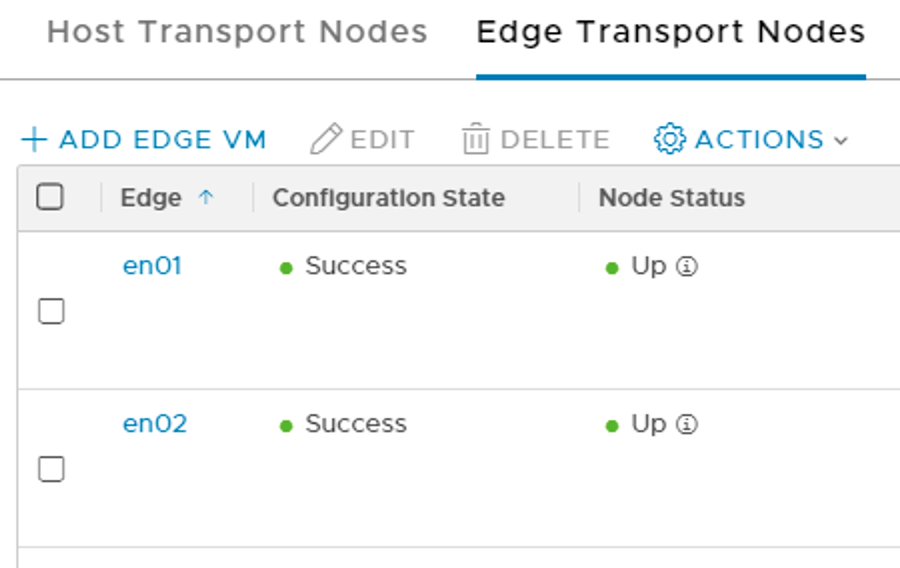
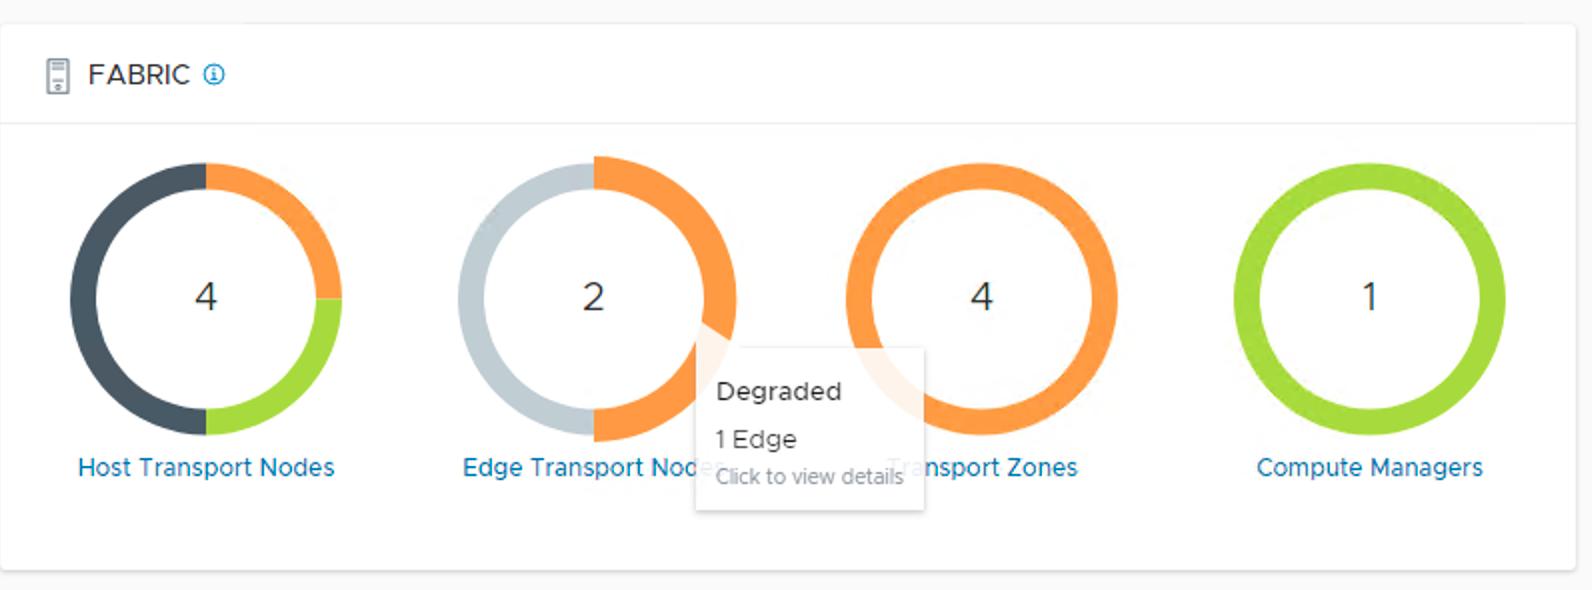
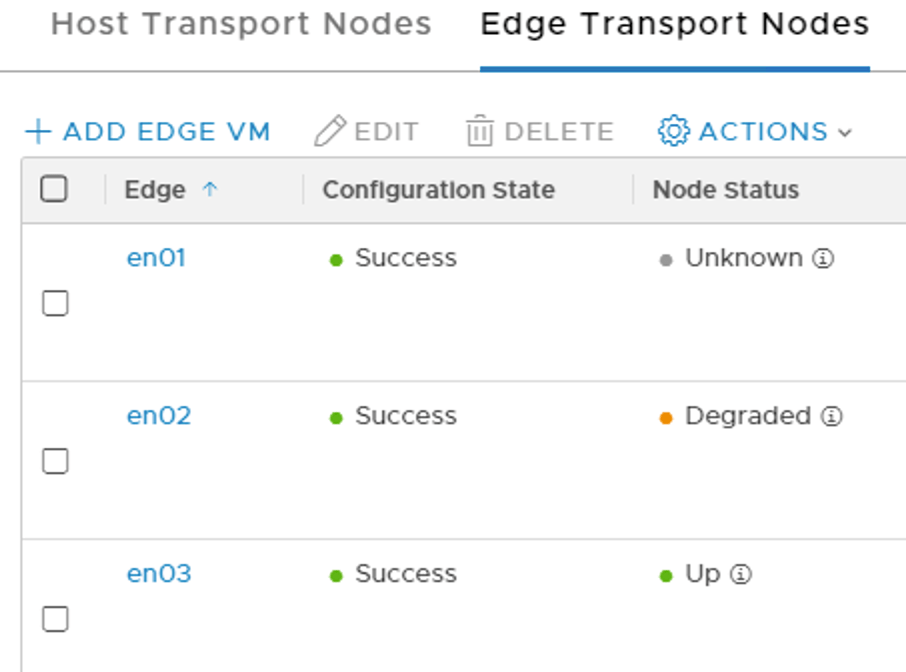
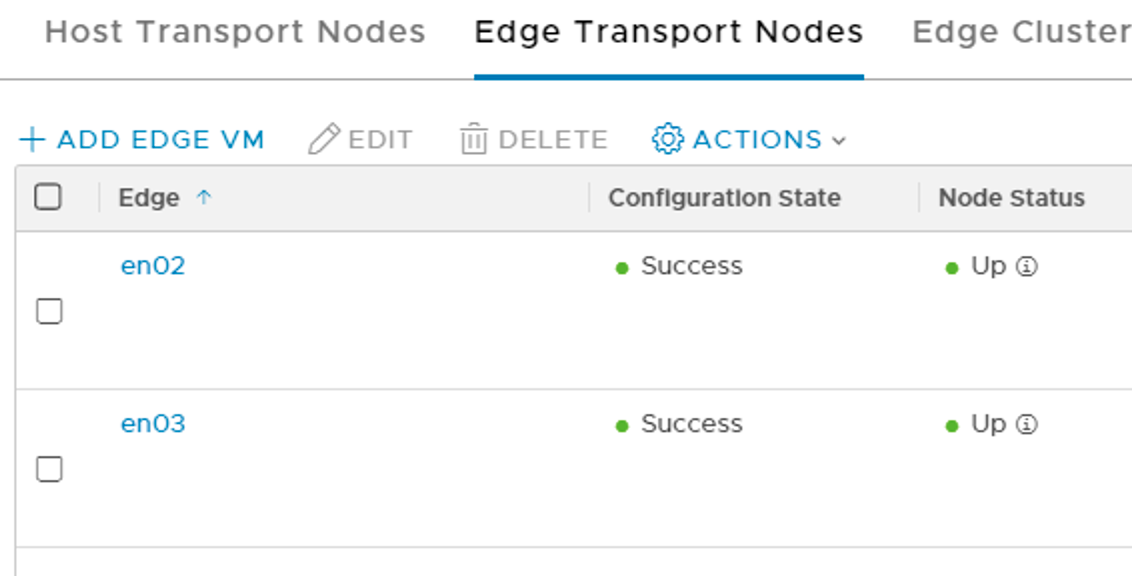
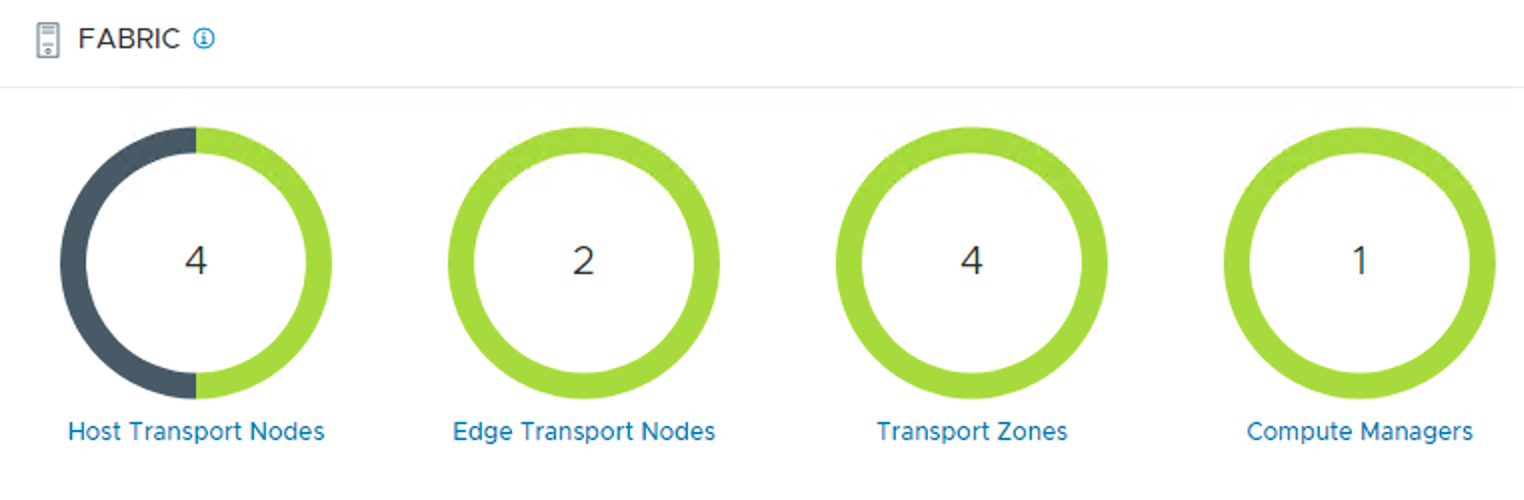
When all hosts have been configured I quickly check the status of the transport nodes:
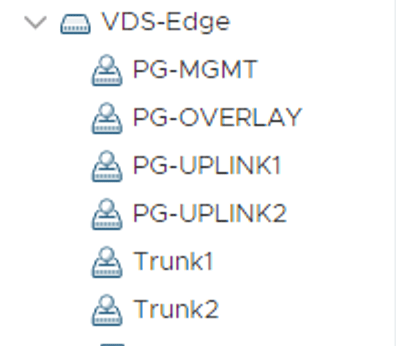
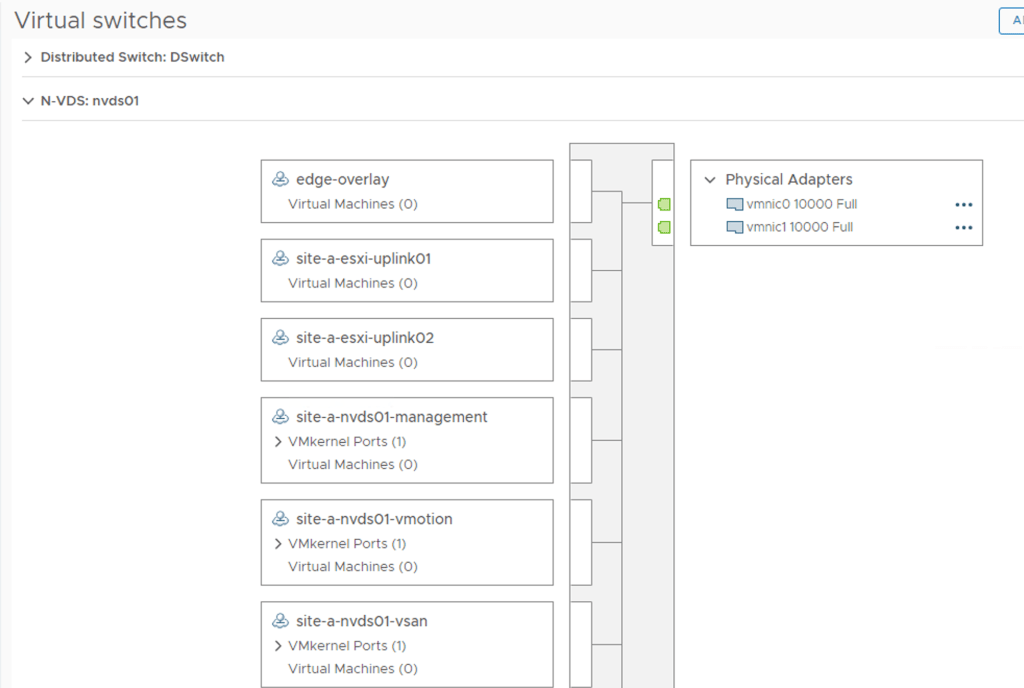
And in vCenter I notice there’s now an N-VDS with a bunch of opaque port groups:
Summary
Most of the NSX-T platform is in place now and I think this is a good point to take a small break.
I started by deploying and configuring the NSX manager cluster (aka the central management plane). Next, I prepared the environment for the NSX data plane by provisioning some VLANs, profiles, and segments. Lastly, I prepared the ESXi hosts in the stretched cluster by installing the NSX VIBs and configuring them as NSX transport nodes. vSphere system networking (vmkernel adapters) was migrated to the N-VDS.
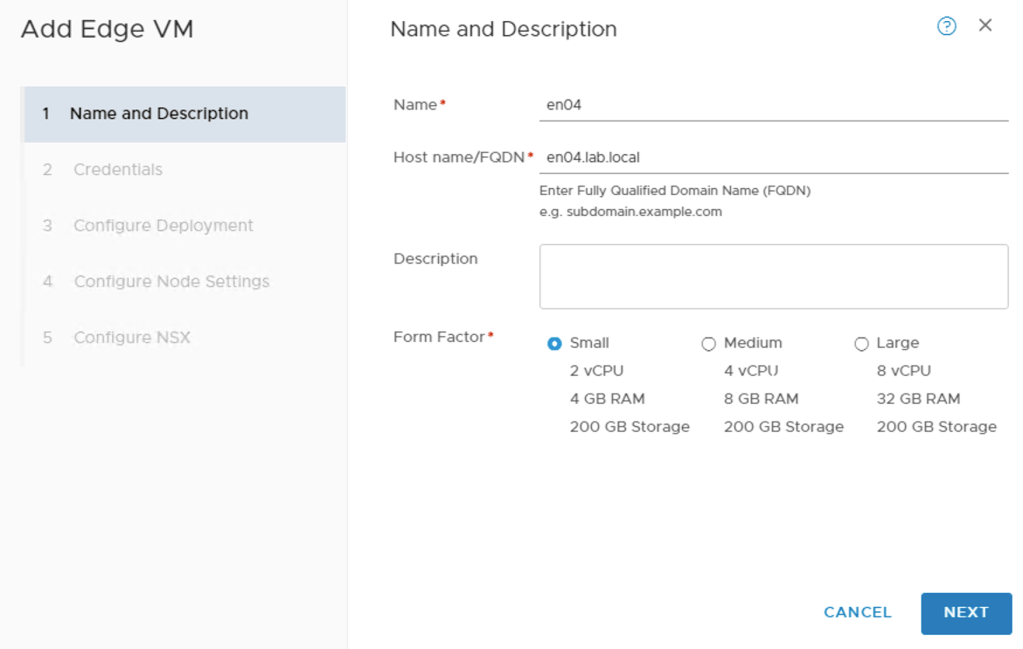
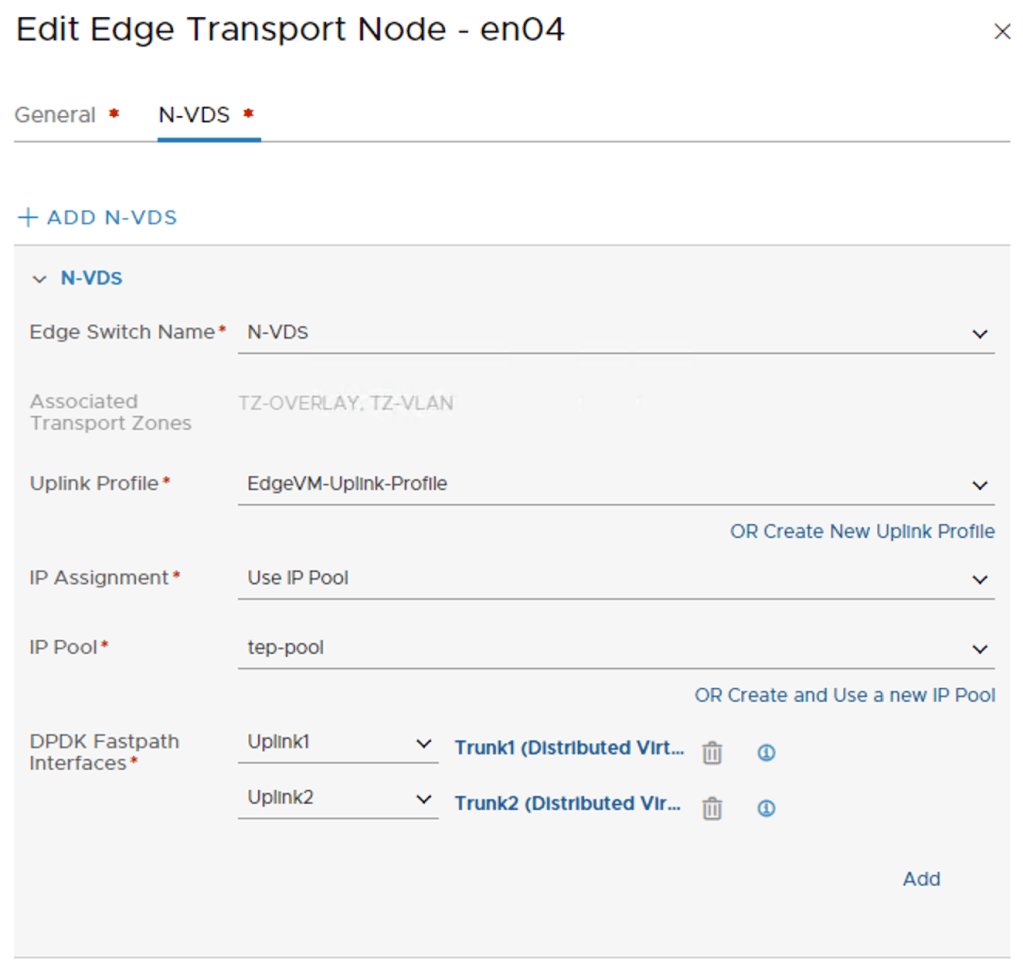
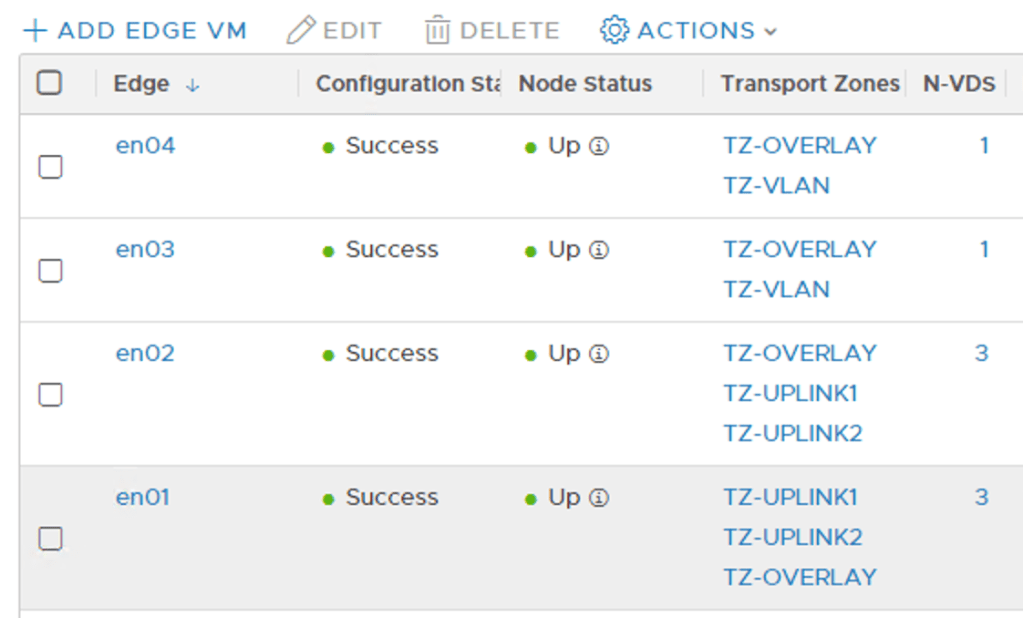
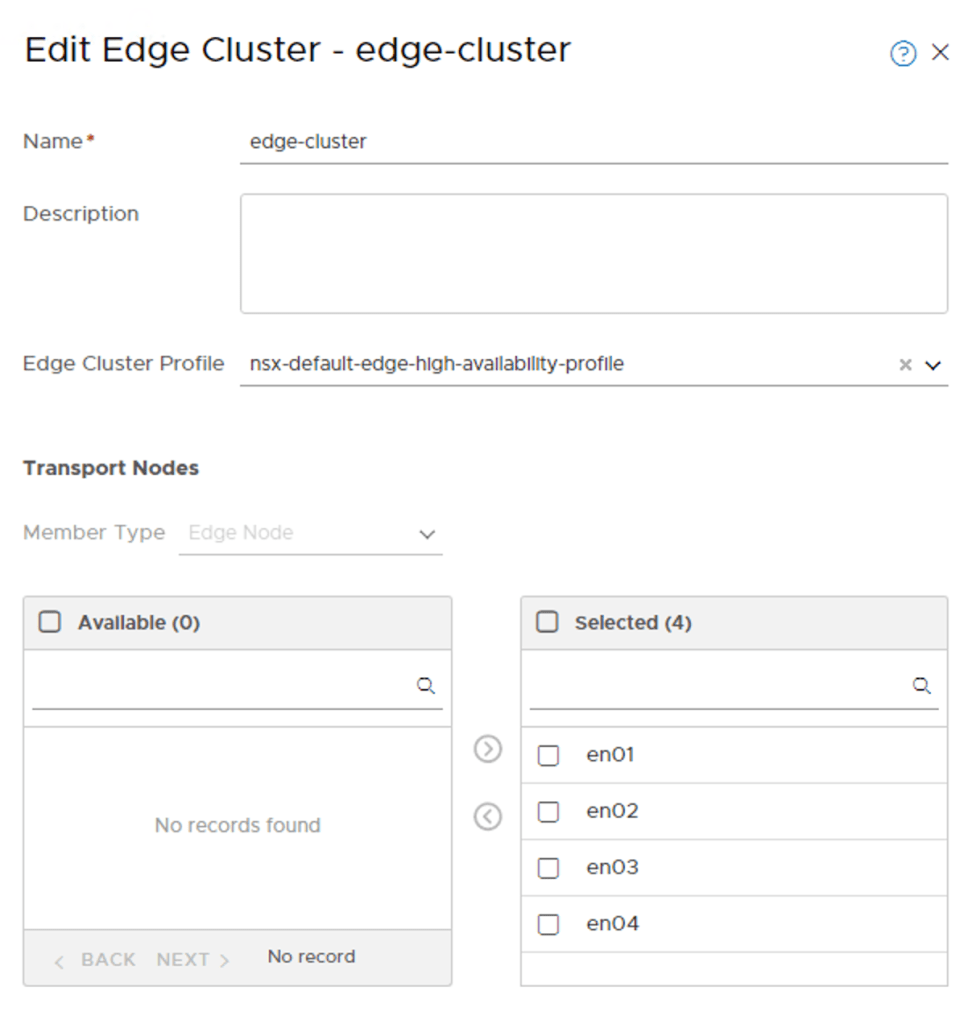
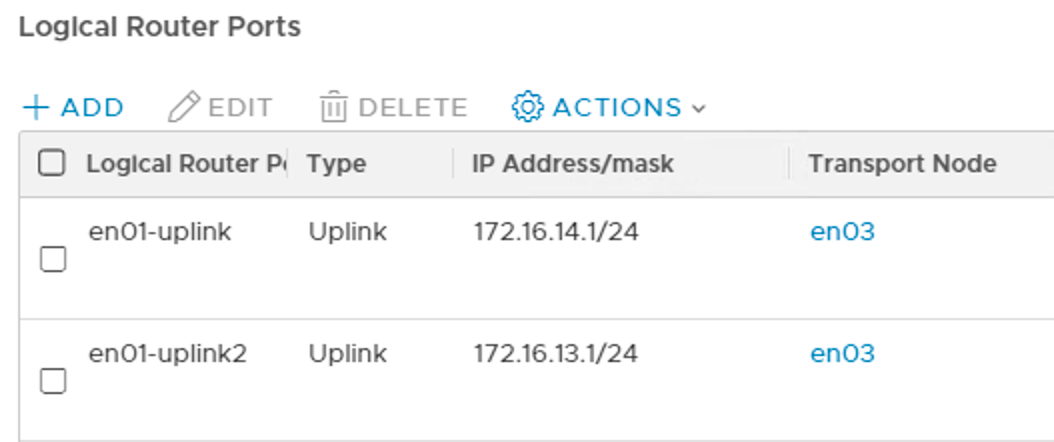
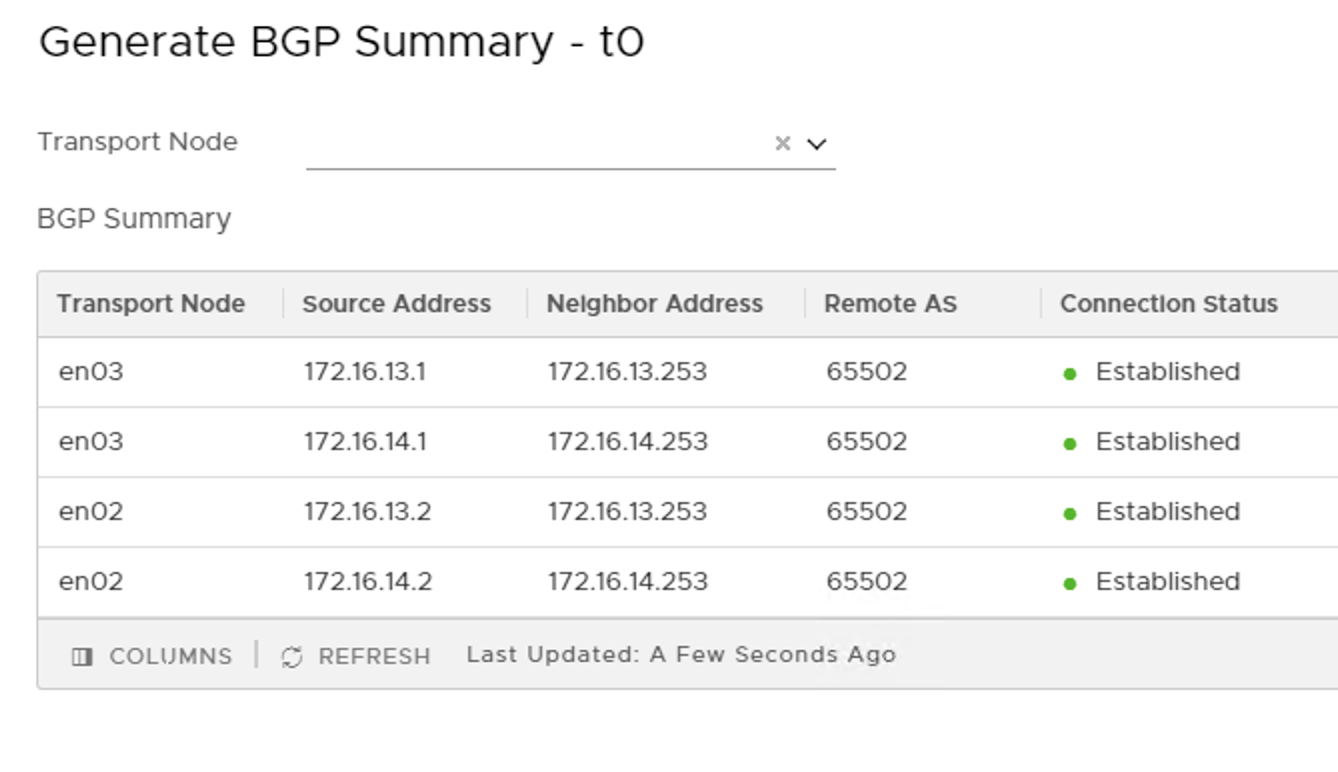
In the next part I will continue with the installation of the data plane and more specifically deployment and configuration of the NSX Edge as well as the logical networking components.
Stay tuned!