Like any other firewall the NSX-T Distributed Firewall (DFW) consumes memory and CPU. Unlike other firewalls the DFW’s resource consumption is distributed, taking place on the transport nodes where the workloads it protects reside.
Memory allocation
An ESXi transport node allocates a fixed amount of memory for the different DFW components. The amount of memory allocated depends on the total amount of RAM installed. For an ESXi host with 128GB RAM or more the allocation looks like this (NSX-T version 2.5):
| DFW Component | Description | Memory Max Size (MB) |
|---|---|---|
| vsip-attr | Stores additional attributes used by the L7 context engine | 1024 |
| vsip-flow | Stores flow monitoring data | 768 |
| vsip-fqdn | Stores resolved FQDN addresses | 512 |
| vsip-module | Memory allocated to the vsip kernel process | 2560 |
| vsip-rules | Stores DFW rules, address sets and containers | 3070 |
| vsip-si | Memory allocated to the service insertion architecture | 128 |
| vsip-state | Stores DFW state (existing connections/connection table) | 512 |
Thresholds
For both DFW memory and CPU usage the default threshold is set at 90%. You can see thresholds and current resource usage by running the “nsxcli -c get firewall thresholds” command on an ESXi transport node:
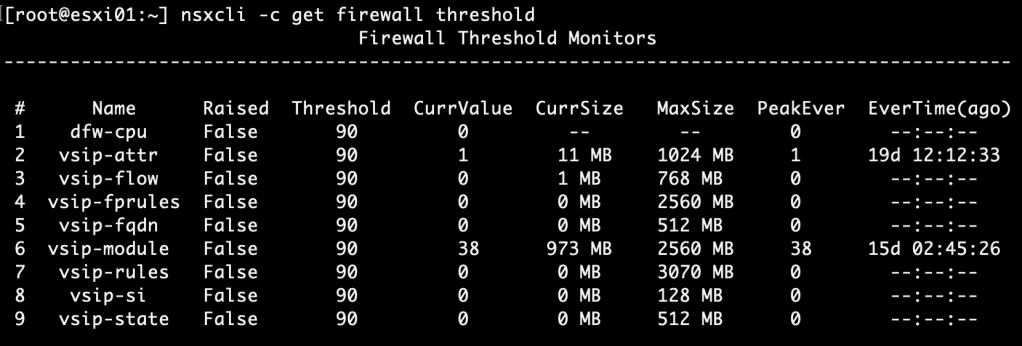
A similar command can be used from an NSX Manager node: “on <transport-node-id> exec get firewall thresholds“.
It’s nice that we can monitor the DFW resource usage on a per transport node basis, but in most environments this method isn’t very practical.
In today’s article I want to have a look at two things concerning DFW resource monitoring. Firstly, at how to configure custom thresholds for memory and CPU usage. Secondly, at how to set up central threshold monitoring with alerting.
Configuring custom DFW thresholds
Below are the steps at a high level for configuring custom DFW thresholds:
- Create an NSGroup containing transport nodes
- Create a threshold profile
- Apply threshold profile
- Verify
Time to get our hands dirty!
Step 1 – Create an NSGroup containing transport nodes
We need to group our transport nodes. Currently only NSGroups, the ones managed by the MP API, support having transport nodes as members.
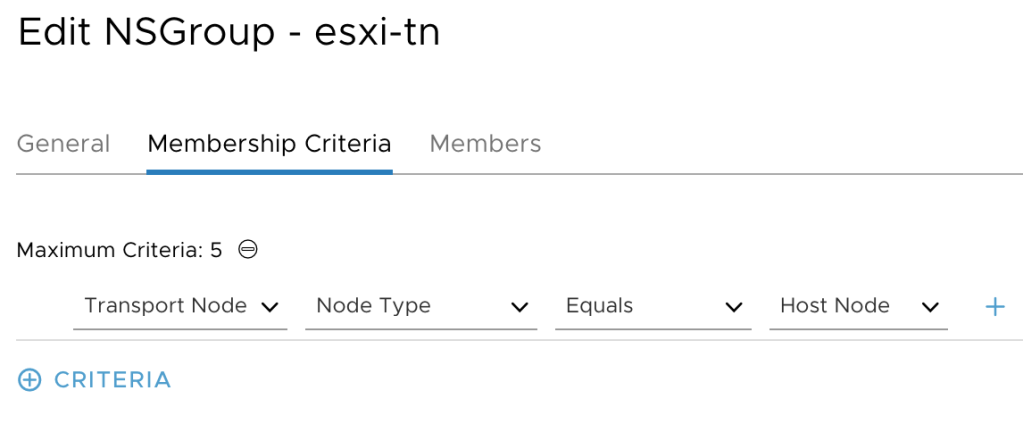
NSGroups are managed under Advanced Networking & Security > Inventory > Groups. I’m creating an NSGroup called “esxi-tn” with a membership criteria that will add all the host transport nodes as members:
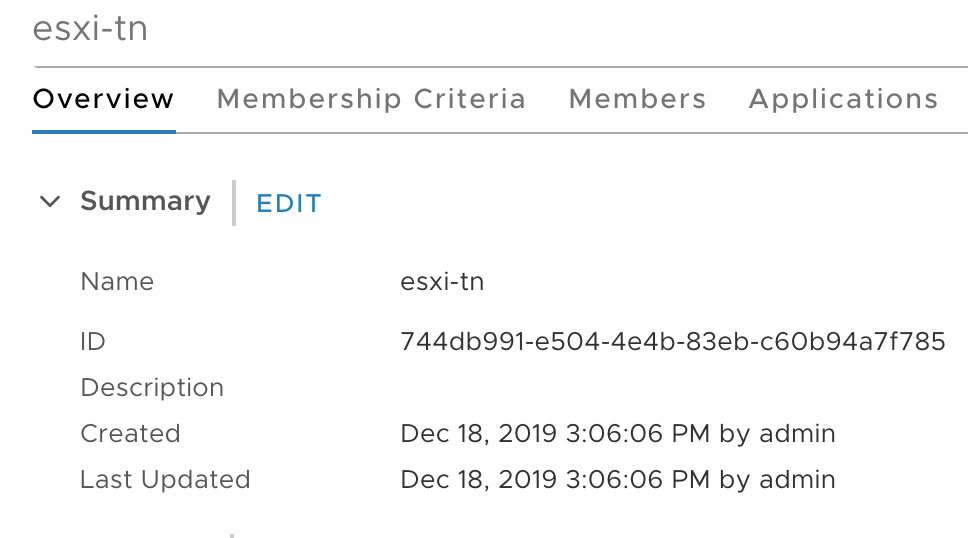
Copy the NSGroup ID to a text file as we need it at step 3:
Step 2 – Create a threshold profile
Using a REST API client we’re going to make a POST request to the NSX MP API:
POST https://{{nsx-manager-fqdn}}/api/v1/firewall/profiles
The request body contains the following piece of JSON code:
{
     "cpu_threshold_percentage" : 75,
     "display_name" : "ESXi DFW Threshold Profile"
     "mem_threshold_percentage" : 75,
     "resource_type" : "FirewallCpuMemThresholdsProfile"
 }
The values for “cpu_threshold_percentage” and “mem_threshold_percentage” will depend on your requirements. For this exercise I’m configuring a threshold at 75% for both memory and CPU usage.
The POST request body and the result:
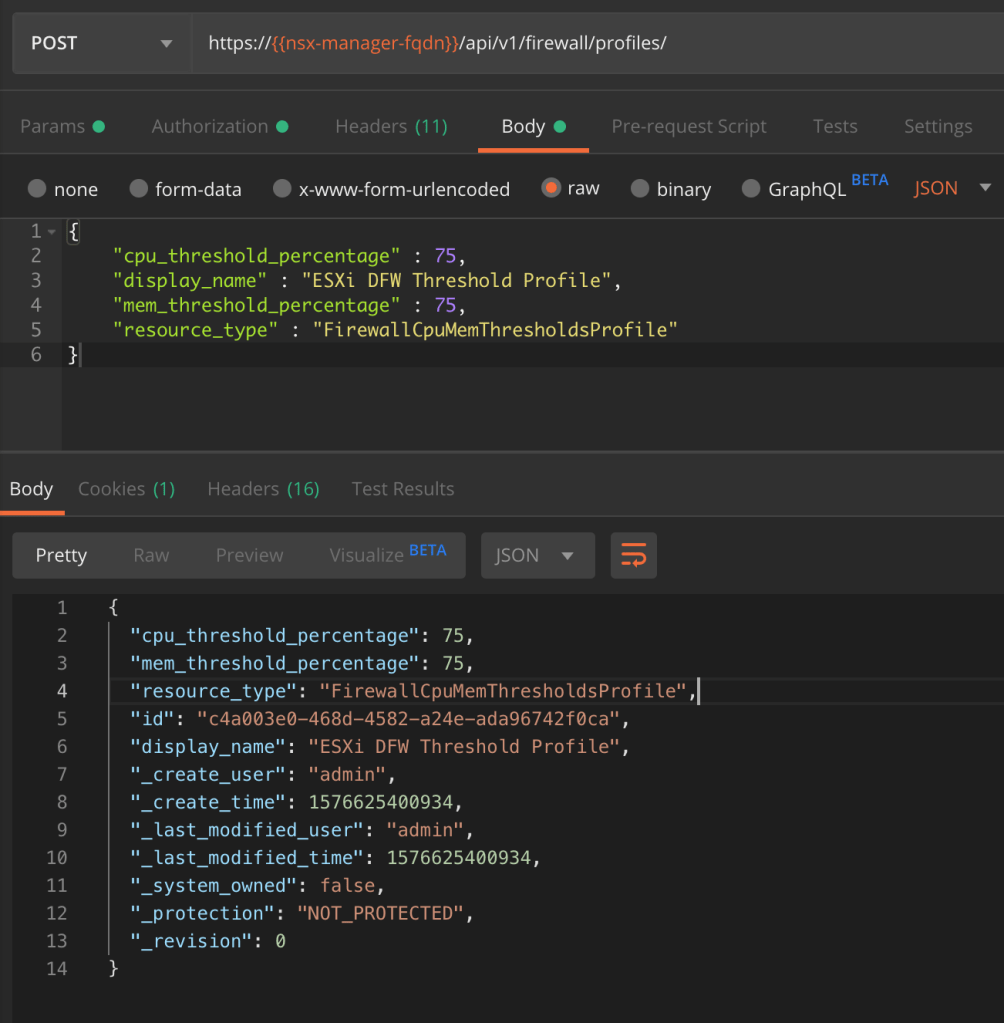
Copy the threshold profile’s ID from the result to a text file as we need it in the next step.
Step 3 – Apply threshold profile
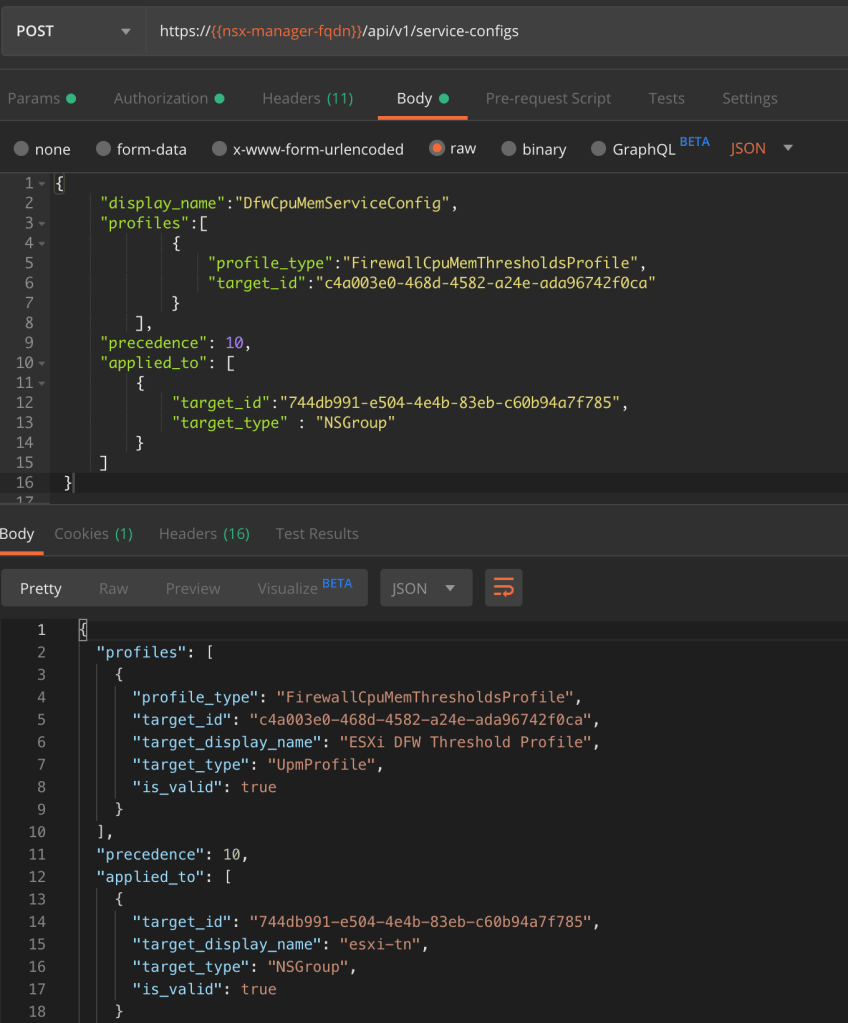
The second API call configures a service-config that links the threshold profile to the NSGroup:
POST https://{{nsx-manager-fqdn}}/api/v1/service-configs
With the following JSON code as the request body:
{
     "display_name":"DfwCpuMemServiceConfig",
     "profiles":[
             {
                 "profile_type":"FirewallCpuMemThresholdsProfile",
                 "target_id":"c4a003e0-468d-4582-a24e-ada96742f0ca"
             }
         ],
     "precedence": 10,
     "applied_to": [
         {
             "target_id":"744db991-e504-4e4b-83eb-c60b94a7f785",
             "target_type" : "NSGroup"
         }
     ]
 }
The threshold profile and the NSGroup IDs that we copied to a text file earlier are used as the values for the two target_ids.
The POST request body and the result:
Step 4 – Verify
An easy way to verify that the new DFW thresholds have been applied is to run the “get firewall thresholds” NSXCLI command. This time I’ll run it from an NSX Manager node:
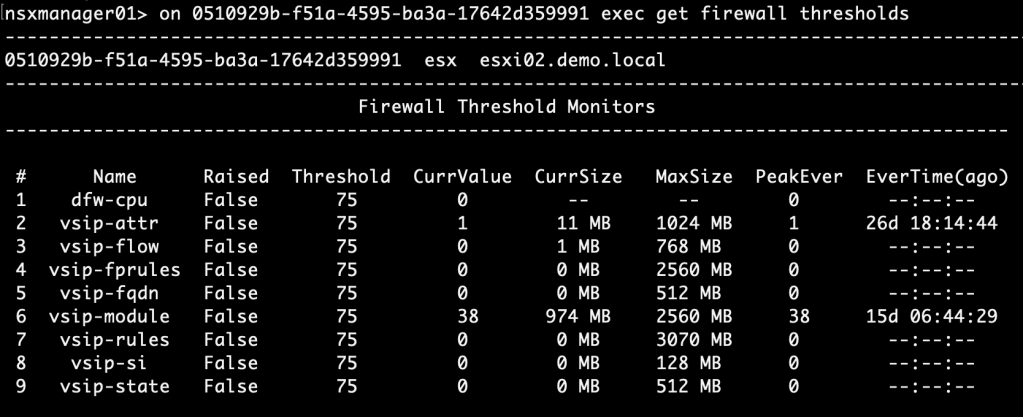
As we see the new threshold value of 75% has been applied.
Setting up alerting
You might wonder what actually happens when a threshold is crossed? Currently there’s no alarming framework in NSX-T so the only thing that happens is that a threshold event is logged to syslog.
Luckily there’s always vRealize Log Insight. Configured as a syslog target for the NSX-T platform, DFW threshold events end up there too:
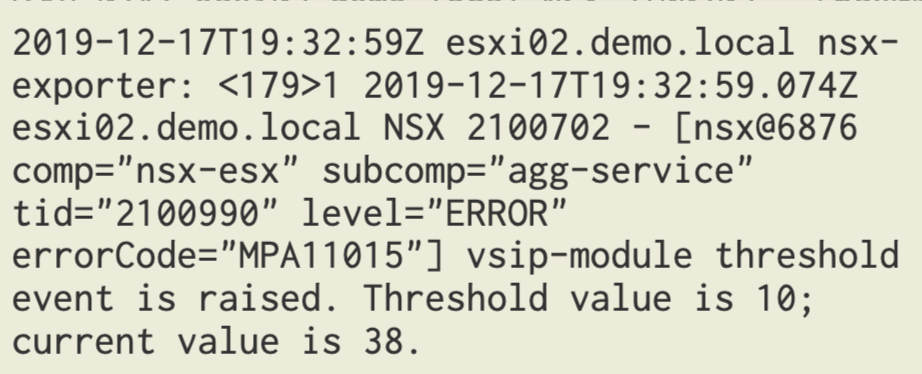
A quick look at a DFW threshold event. We see things like the transport node, the DFW component that crossed the threshold, as well as the configured threshold and the current usage.
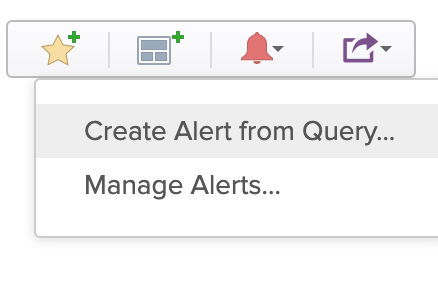
Now that we know what a threshold event looks like, it’s easy to configure an alert based on the query in vRLI:
text contains “threshold event is raised”
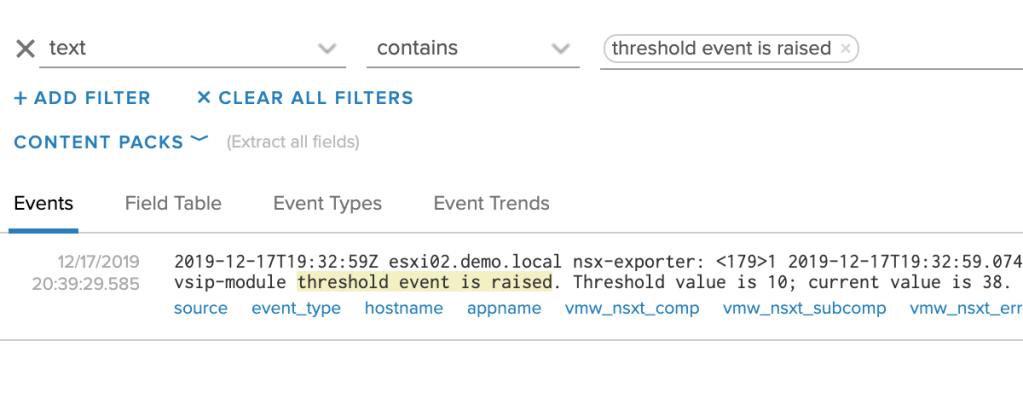
Click on “Create Alert from Query”:
Fill out the details for the new alert:
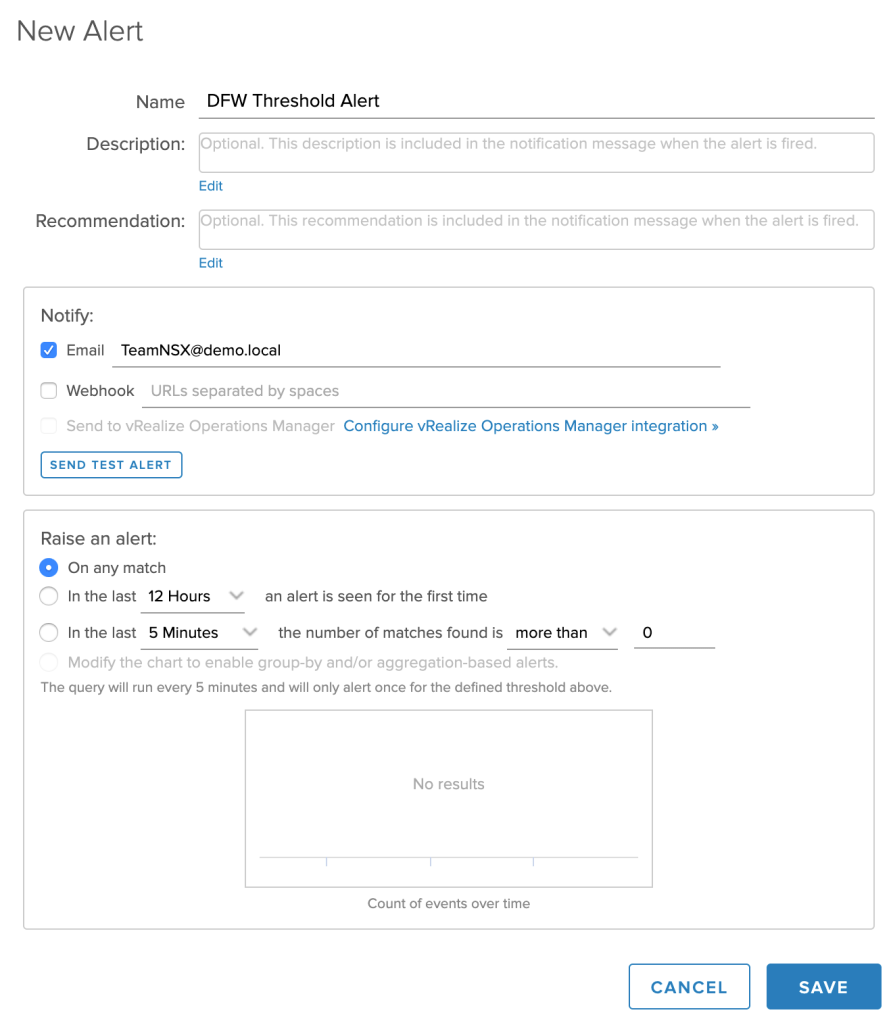
And that’s it. From now on you’ll be notified each time a DFW threshold is crossed.
Summary
Configuring custom DFW thresholds and monitoring these with Log Insight isn’t too hard to set up.
It’s true that with a proper DFW design and by sticking to good practices for implementation, problems related to DFW memory or CPU usage are rare. That being said, it’s not a bad idea to keep an eye on the DFW’s resource utilization. Just in case.

Leave a comment