Hi and welcome back. We’re looking into the NSX-T data path and investigating different points at which we can capture network traffic.
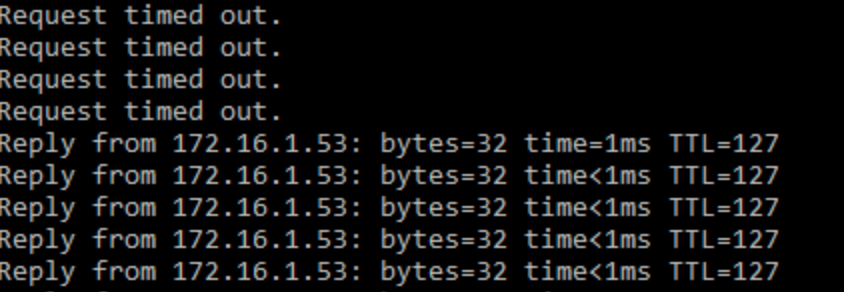
You may remember from part one that virtual machine “app01” (172.16.2.50) is trying to ping another virtual machine called “web01” (172.16.1.53), but it’s receiving “request timeout”. We’re trying to find out where in the data path we’re having an issue.
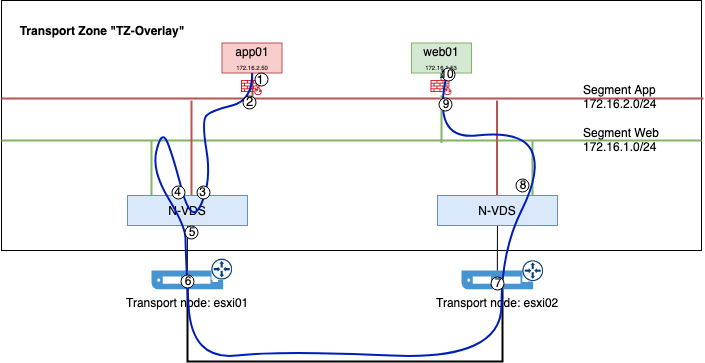
So far we have seen the ICMP packets at the following points:
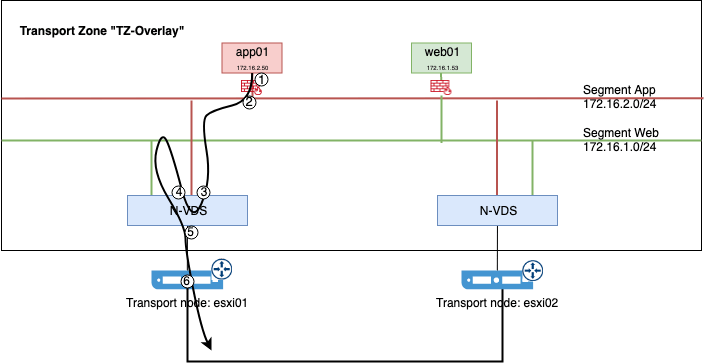
We captured traffic pre (1) and post (2) distributed firewall. Next, we ran captures before (3) and after (4) traffic got routed by the distributed logical router. In part two we first observed the ICMP packets going through the N-VDS uplink (5) and then again at the vmnic (6). Here we had to dig a bit deeper as the packets got Geneve encapsulated.
Reference points
In this final part of the series we look at the remainder of the data path for the ICMP packets. More precisely we will cover these points today:
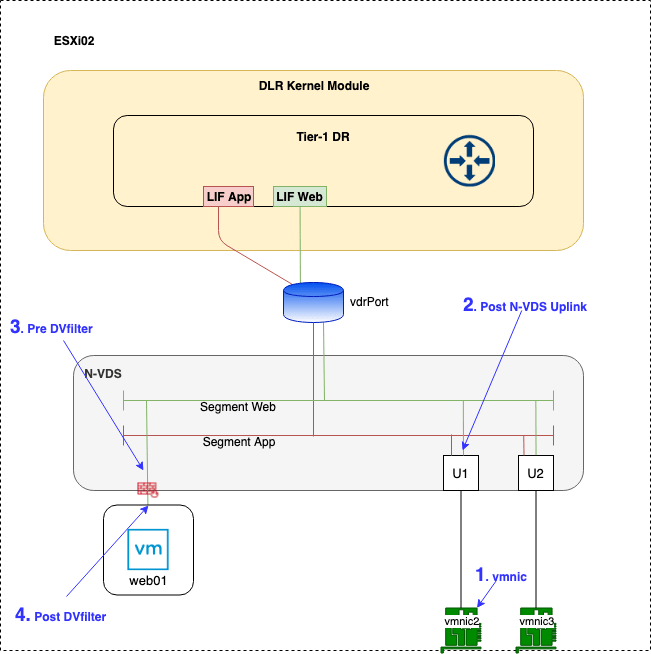
Reference point 1 – vmnic
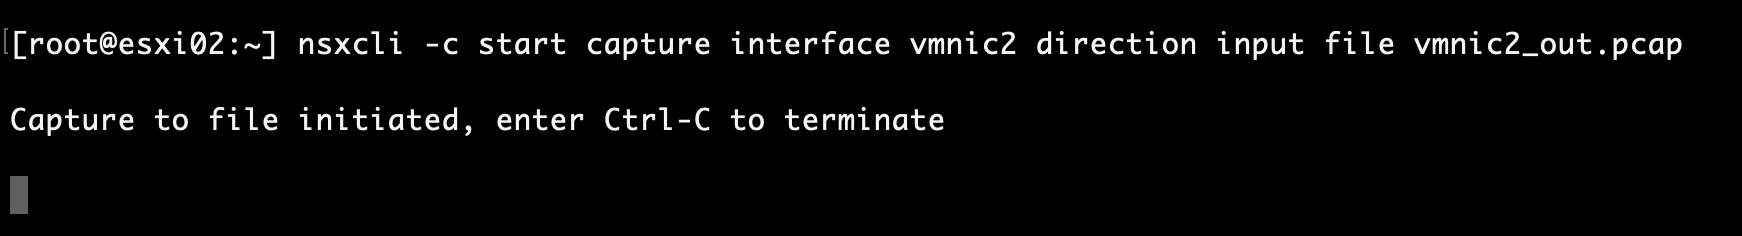
After the encapsulated packets traveled the overlay transport VLAN, they arrive at the destination ESXi host’s physical NIC. What do we see at this point? Let’s see:
nsxcli -c start capture interface vmnic2 direction input file vmnic2_in.pcap
Opening the pcap file in Wireshark reveals the following:

So, this confirms that the ICMP packets survived their journey over the physical network and have indeed arrived at ESXi02’s physical NIC.
Reference point 2 – Post N-VDS Uplink
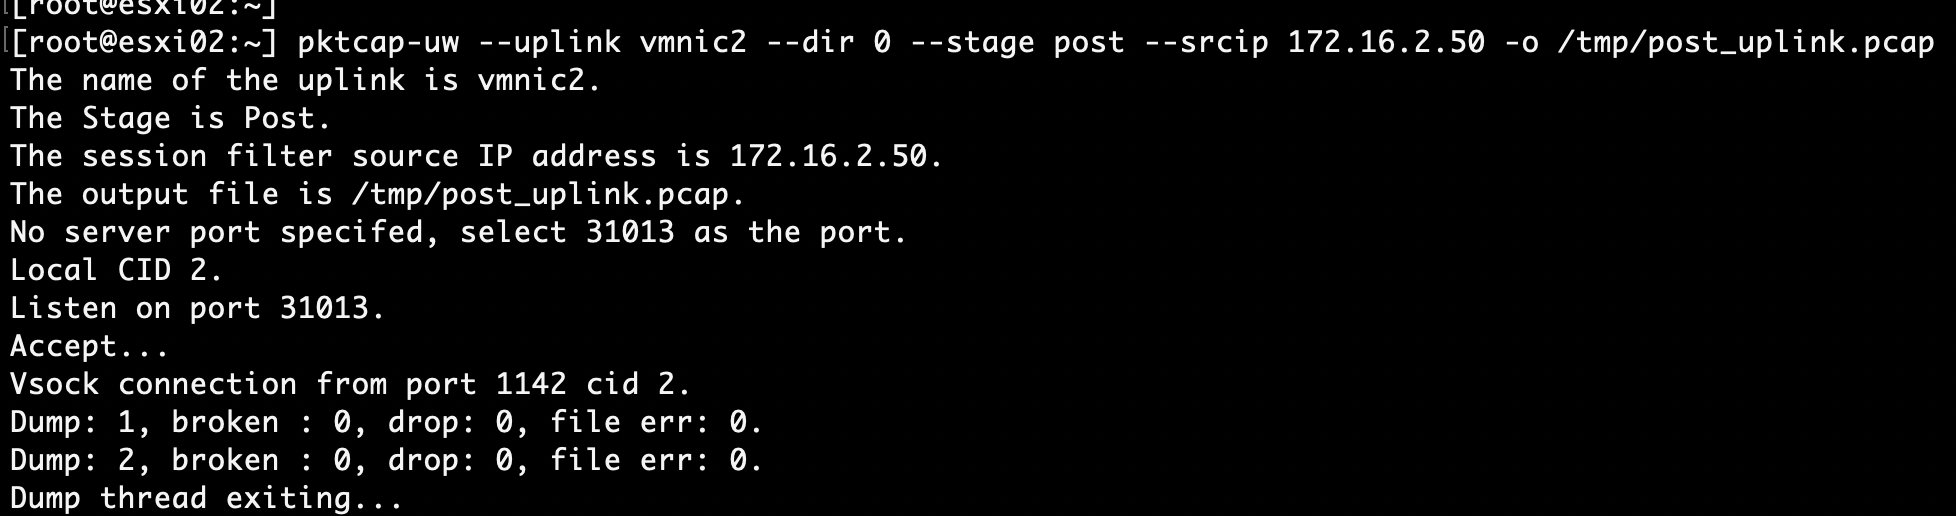
At this point the ICMP packets should have been decapsulated by the receiving TEP. To see the packets right after decapsulation, we need to use the pktcap-uw command which supports the “stage” parameter when capturing traffic at the uplink level. This is something nsxcli does not support yet.
As pktcap-uw doesn’t interpret packet contents, we will capture traffic to a pcap file:
pktcap-uw --uplink vmnic2 --dir 0 --stage post --srcip 172.16.2.50 -o /tmp/post_uplink.pcap
To read the contents of the pcap file we can use Wireshark, but in this case we’ll do a quick read using the tcpdump-uw command:
tcpdump-uw -r /tmp/post_uplink.pcap
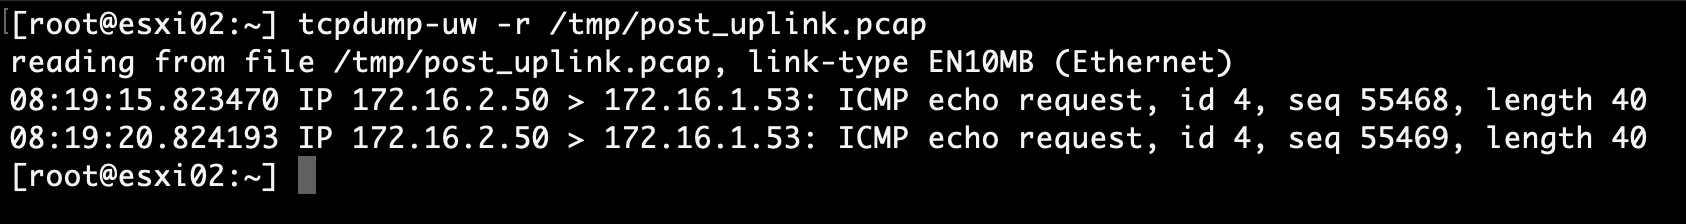
And there we see the ICMP packets right after being decapsulated.
Reference point 3 – Pre DVfilter
After decapsulation the packets are heading towards the destination virtual machine (web01). Remember they were already routed to the destination NSX-T segment on the source ESXi host. Distributed routing FTW!
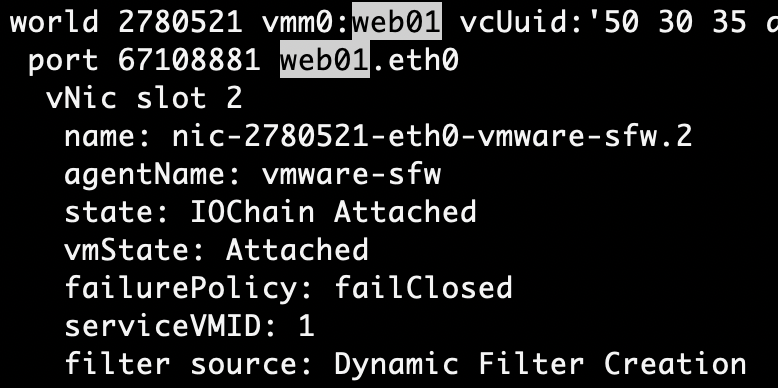
Before the packets get access to web01’s guest OS, they once again need to go through a distributed firewall filter. This time the one that is applied to web01’s vNIC slot 2.
First we need to get hold of the filter’s name:
summarize-dvfilter | less -p web01
Next we capture traffic pre this filter:
nsxcli -c start capture dvfilter nic-2780521-eth0-vmware-sfw.2 stage pre expression srcip 172.16.2.50

And we’re seeing the ICMP packets!
Reference point 2 – Post DVfilter
Now let’s see if we can see the packets after it being processed by the distributed firewall rules:
nsxcli -c start capture dvfilter nic-2780521-eth0-vmware-sfw.2 stage post expression srcip 172.16.2.50

Nothing coming through! Some DFW rule must still be dropping the ICMP packets.
Let’s have a look in NSX Manager:
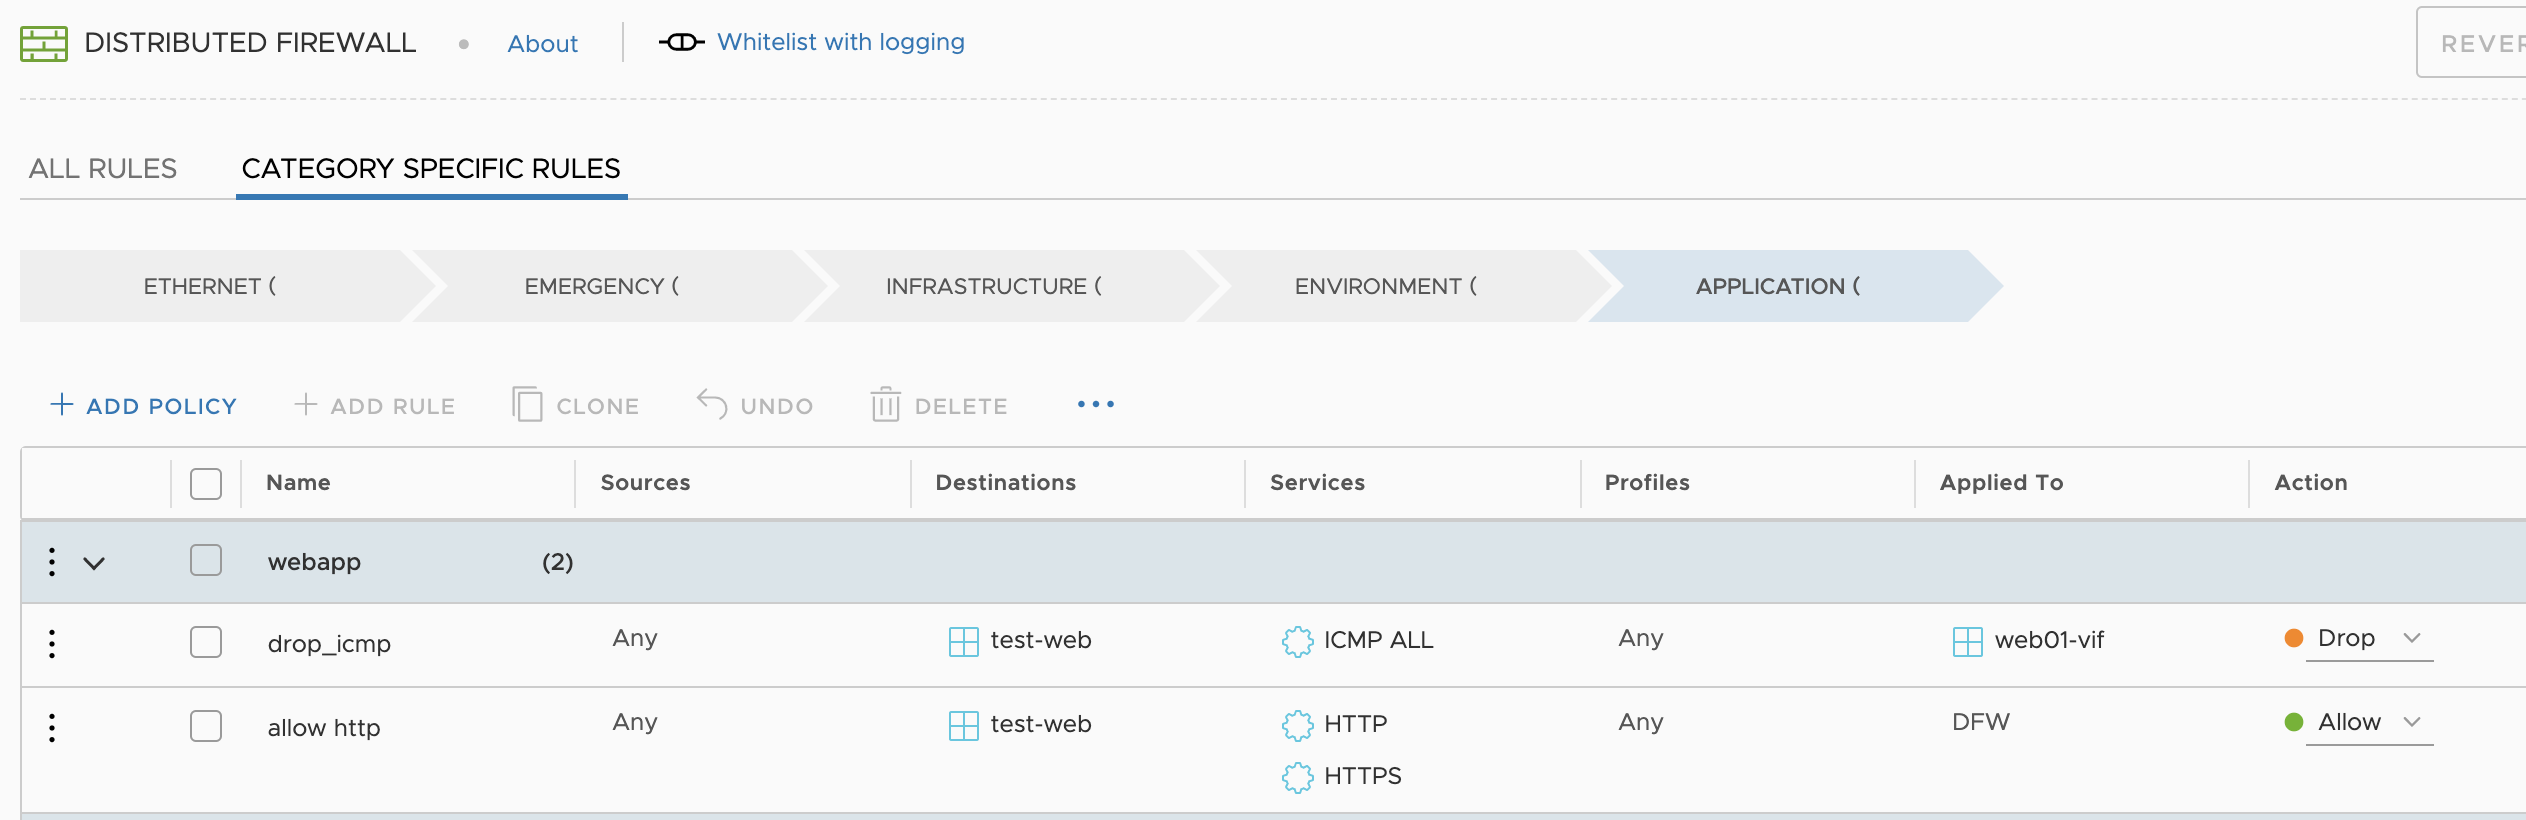
Another DFW rule dropping ICMP traffic destined for web01! How could we have missed that! 😉
After changing the rule’s action to “allow” the capture immediately starts showing output:
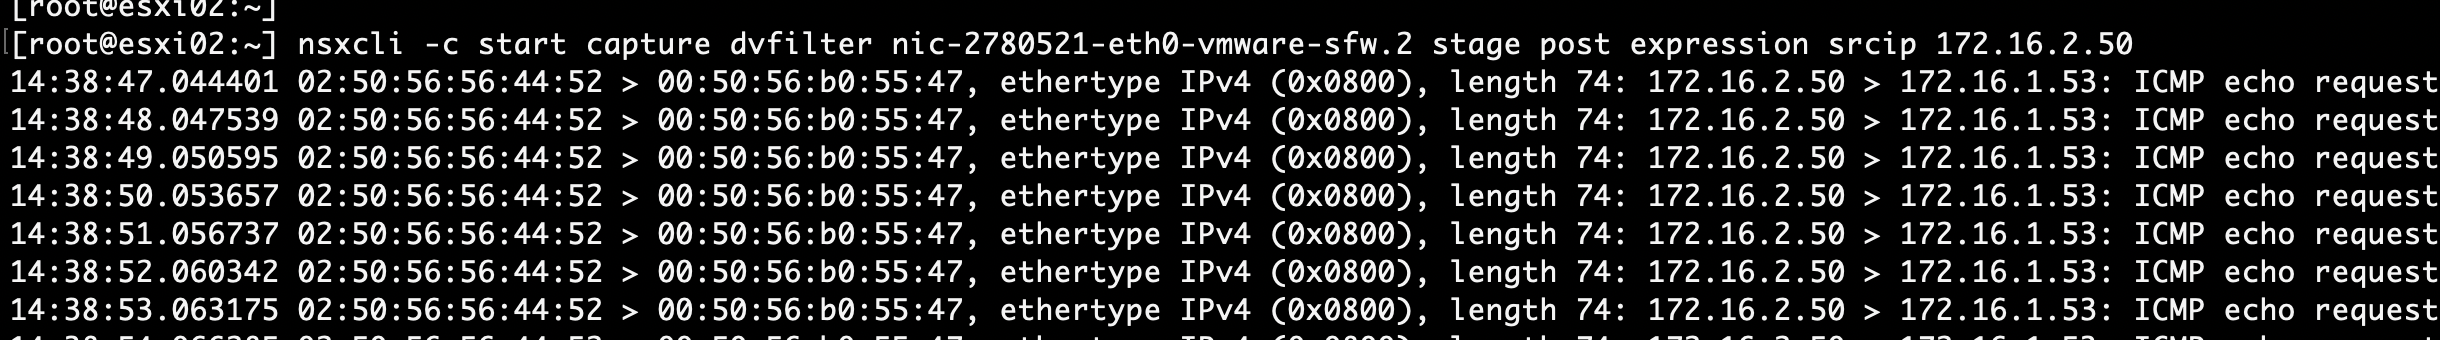
And the app01 virtual machine starts receiving its replies:
What we should’ve done instead
The whole ICMP timeout issue was kind of hypothetical of course. If we ever need to troubleshoot VM-to-VM communication in NSX-T the first tool that comes to mind is Traceflow in NSX Manager. Using Traceflow the ICMP issue in our scenario would have been solved in a second. Let’s have a look.
In NSX Manager navigate to Advanced Network & Security > Tools > Traceflow:
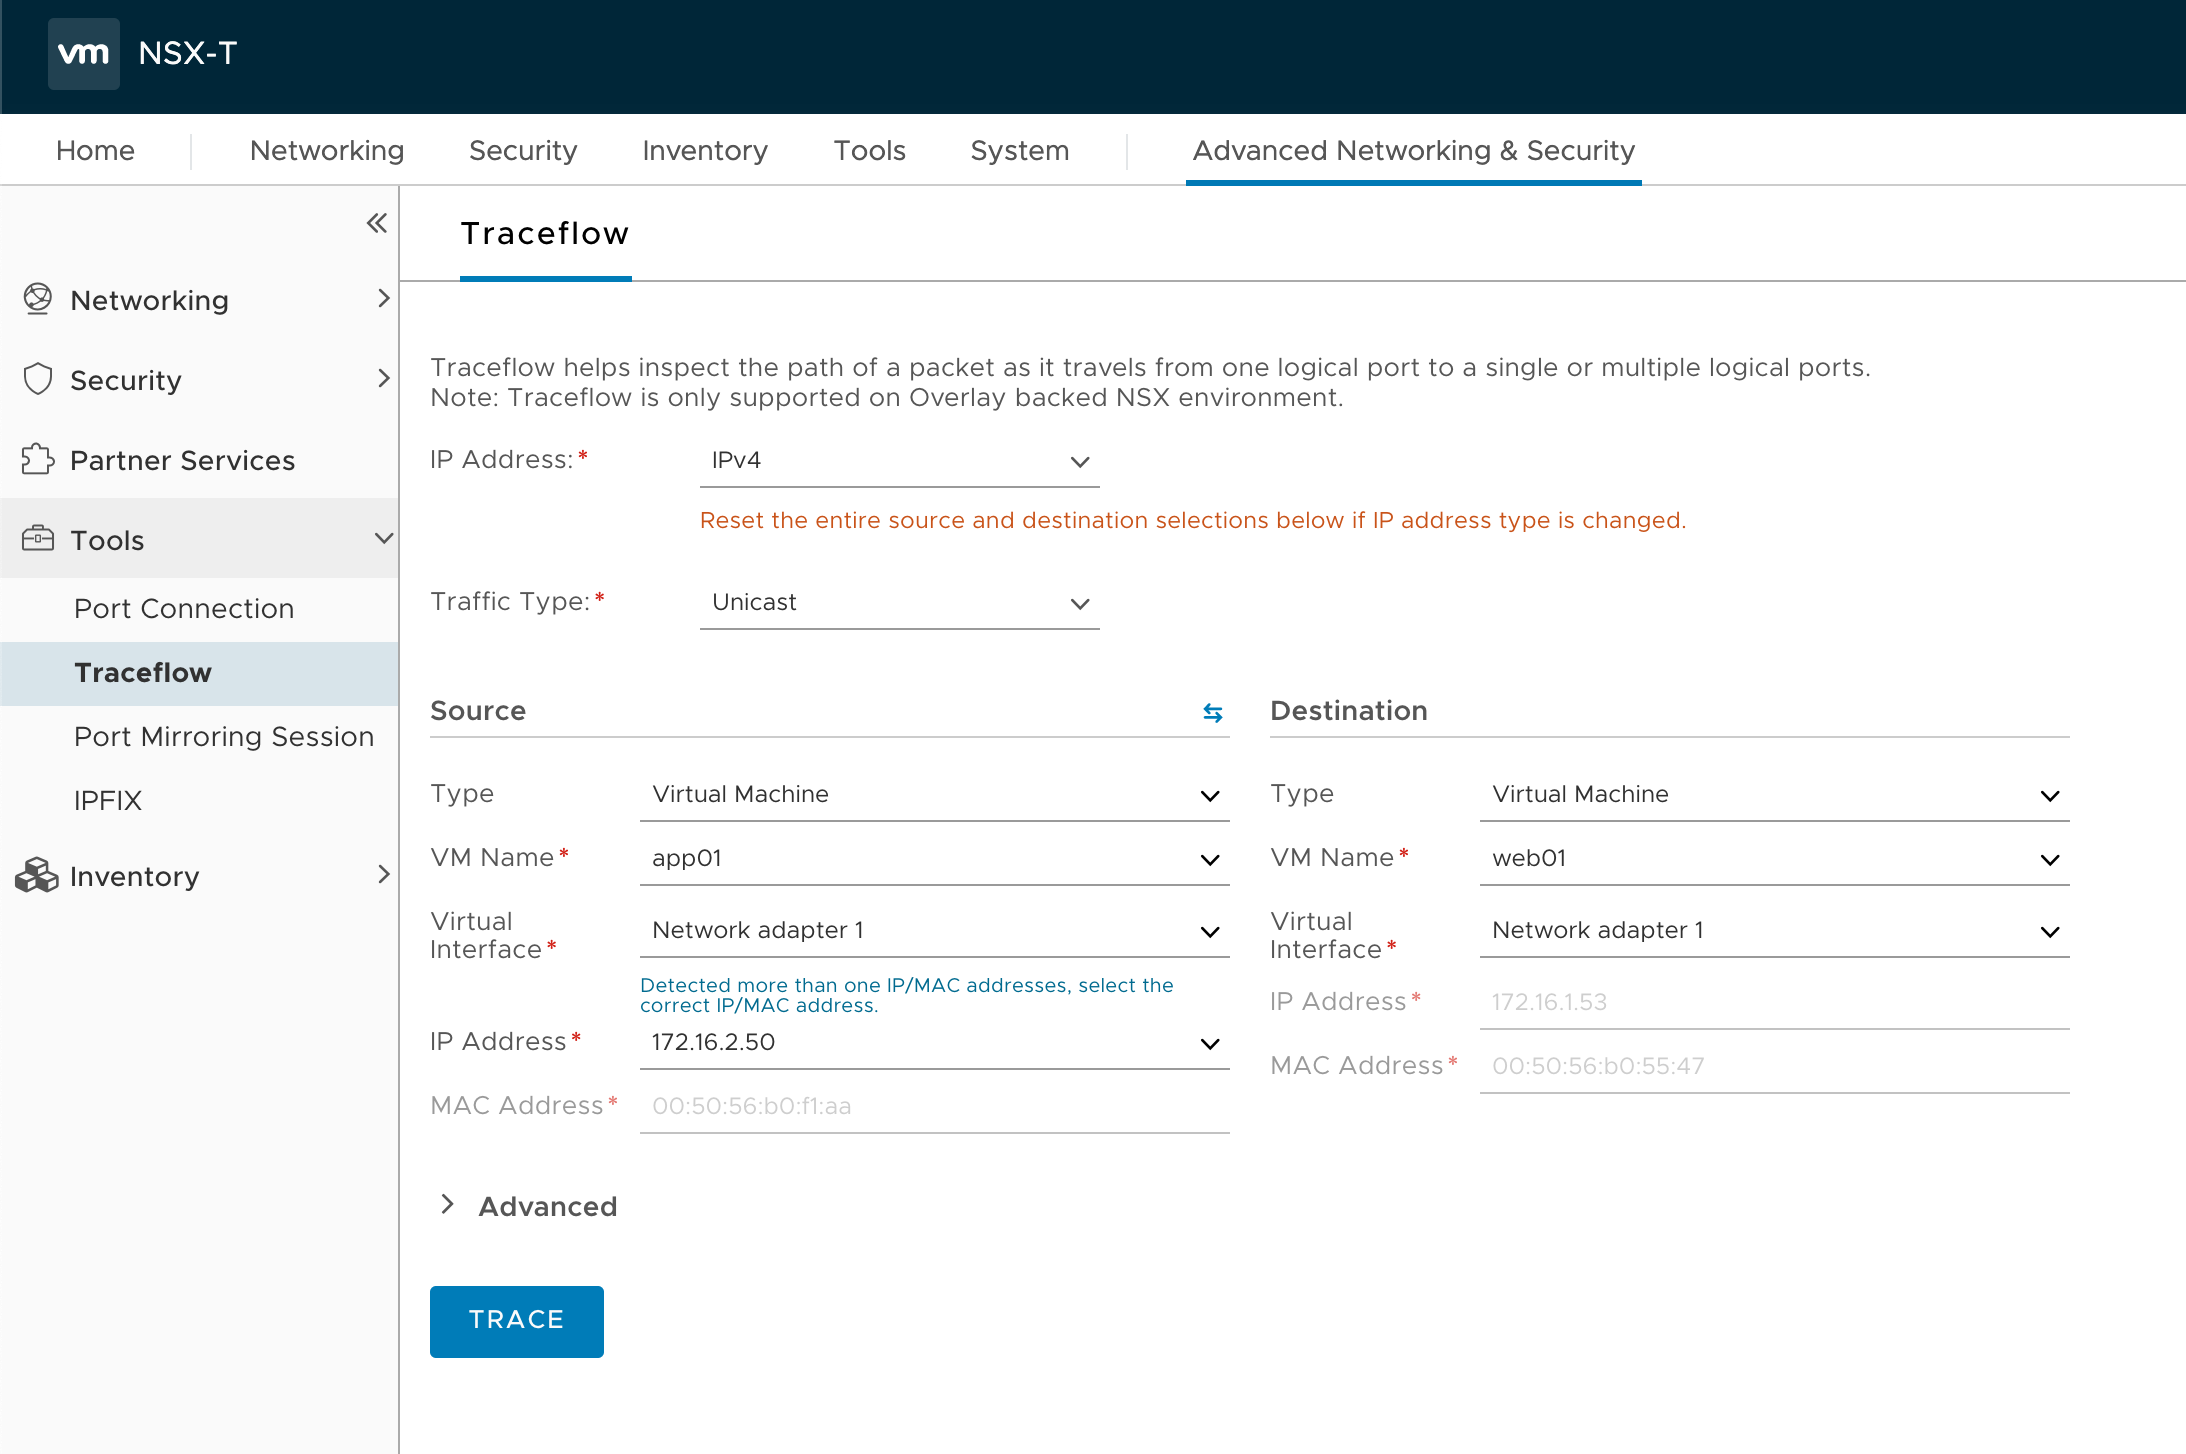
We pick the source (app01) and destination (web01) virtual machine we click “Trace“:
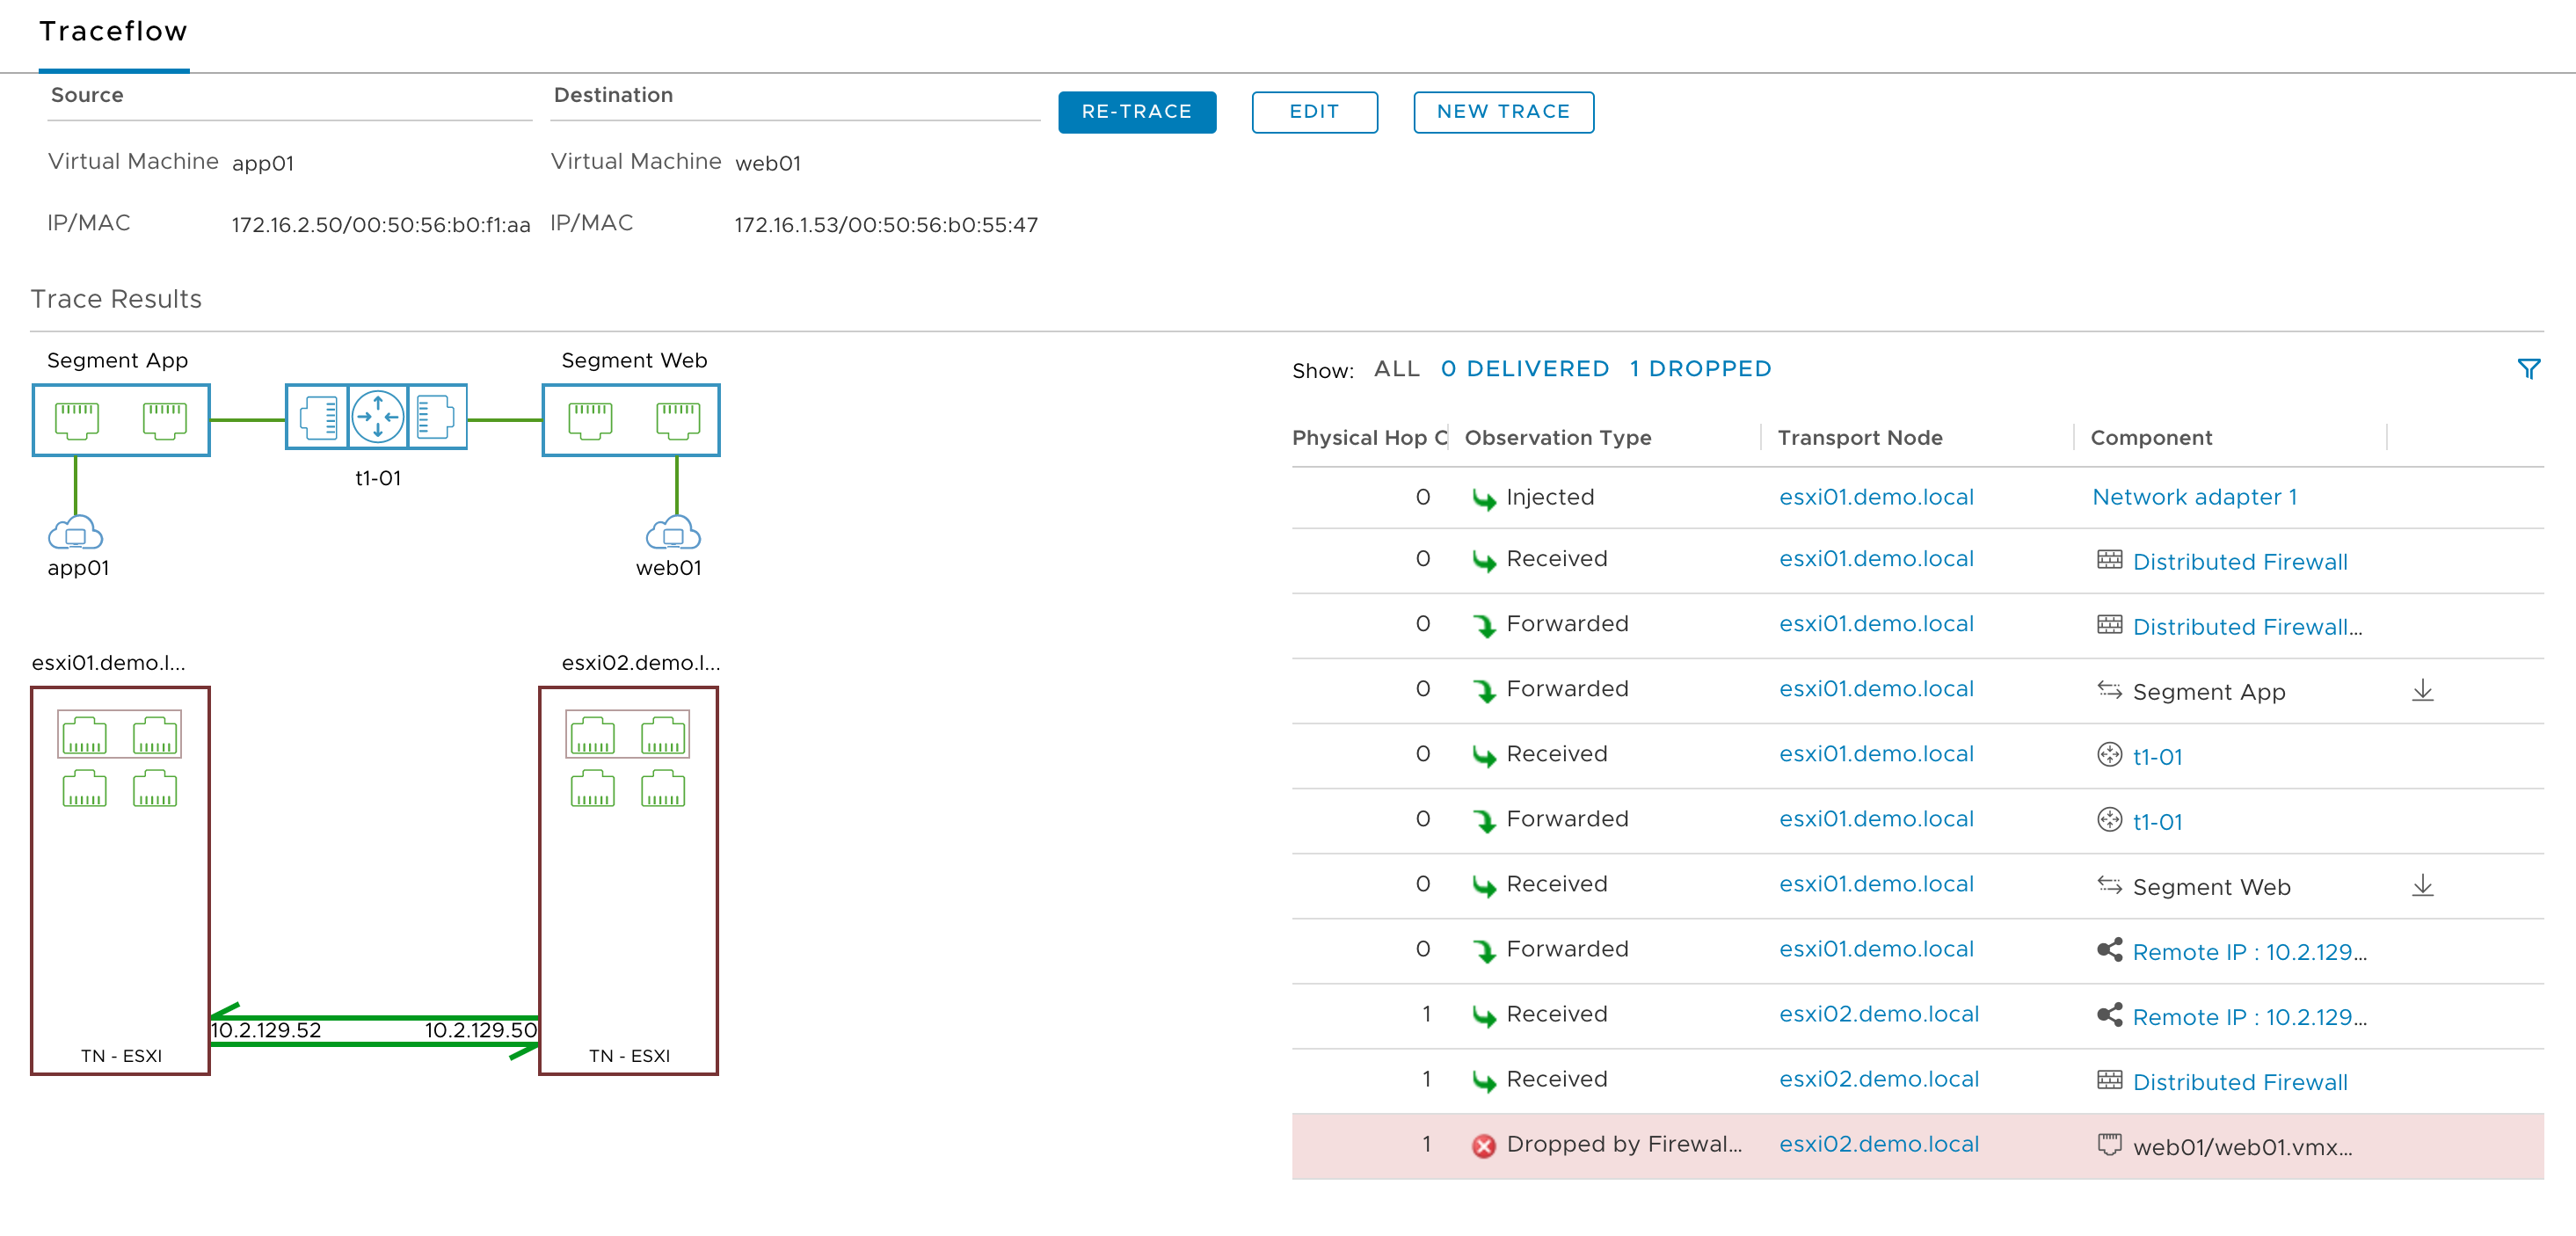
In a matter of seconds the trace result shows us exactly where in the data path we’re having an issue.
Summary
It’s been quite a journey. Let’s summarize:
We looked at 10 points in the NSX-T data path. At each of these points we captured traffic. The following table is an overview of the command used at each point:
| Point | Capture Command |
|---|---|
| 1 | nsxcli -c start capture dvfilter nic-2103285-eth0-vmware-sfw.2 stage pre expression dstip 172.16.1.53 |
| 2 | nsxcli -c start capture dvfilter nic-2103285-eth0-vmware-sfw.2 stage post expression dstip 172.16.1.53 |
| 3 | nsxcli -c start capture interface vdrPort direction output expression dstip 172.16.1.53 |
| 4 | nsxcli -c start capture interface vdrPort direction input expression dstip 172.16.1.53 |
| 5 | nsxcli -c start capture interface uplink1 direction output expression dstip 172.16.1.53 |
| 6 | nsxcli -c start capture interface vmnic2 direction output file vmnic2_out.pcap |
| 7 | nsxcli -c start capture interface vmnic2 direction input file vmnic2_in.pcap |
| 8 | pktcap-uw –uplink vmnic2 –dir 0 –stage post –srcip 172.16.2.50 -o /tmp/post_uplink.pcap |
| 9 | nsxcli -c start capture dvfilter nic-2780521-eth0-vmware-sfw.2 stage pre expression srcip 172.16.2.50 |
| 10 | nsxcli -c start capture dvfilter nic-2780521-eth0-vmware-sfw.2 stage post expression srcip 172.16.2.50 |
There are other tools available to gain visibility into the NSX-T data path. We talked briefly about the Traceflow tool in NSX Manager. The Port Mirror module in NSX Manager is another very powerful tool. And then of course we have VMware’s flagship product for analyzing, optimizing and troubleshooting network traffic vRealize Network insight.
I still believe it’s important to also have a good understanding of the NSX-T data path on the level we discussed in these articles. It makes troubleshooting and working with higher level tools easier.

Leave a comment