Anybody working with NSX micro-segmentation knows the importance of monitoring application traffic and the associated distributed firewall rules.
Today I just want to share a simple and quick way to increase visibility in the NSX distributed firewall logs.
For this short article I’m using NSX-T 2.4.1 and vRealize Log Insight 4.8. vRealize Log Insight has been configured as the syslog target within NSX-T and on the ESXi hosts.
Step 1 – Enable DFW rule logging
It all starts by enabling logging for the distributed firewall rules of interest. This can be done in a number of different ways, but today I’ll stick to the NSX Manager UI.
Select Security > Distributed Firewall and select the firewall rule(s) of interest. Click the three dots in the bar on the top and select Enable > Enable rule logs:
Step 2 – Tag the rule
Click the little gear icon all the way on the right side of the rule:
Now add a tag with a name that makes sense to you. In my example I will add the infra-dns tag to the rule. Click Apply:
Step 3 – Happy tracing!
You’ll have to wait until traffic hits your tagged firewall rule, but once it does, log in to vRealize Log Insight and select the Interactive Analytics tab. Here you type your firewall rule’s tag in the search bar and hit search:
Voilà! Log entries for the firewall rule.
Conclusion
Placing tags on firewall rules makes it just a little easier to find and follow up on log entries for these rule. Yes, we do have the firewall rule ID too, but that’s a number and not very human readable.
Wether you like it or not, the API plays a significant role when installing, configuring, and managing an NSX-T environment. Sooner or later you will be facing tasks that either require you to use the API or simply are much faster to complete using the API.
Luckily, with the right tools and some preparation, getting started with API-based management isn’t all that hard.
In this article I will show you how I set up REST API Client Postman for interaction with the NSX-T API.
Step 1 – Download and install Postman
A pretty obvious first step. We need to download and install Postman. Get it from https://www.getpostman.com/.
Step 2 – Create a Postman environment
After we’ve installed Postman, we should create a Postman environment for our NSX-T environment.
An environment in Postman is a place where you create and store variables with their values. These can then be used within API requests. Using environment variables is a real time saver.
To create an environment in Postman choose File > New and select Environment.
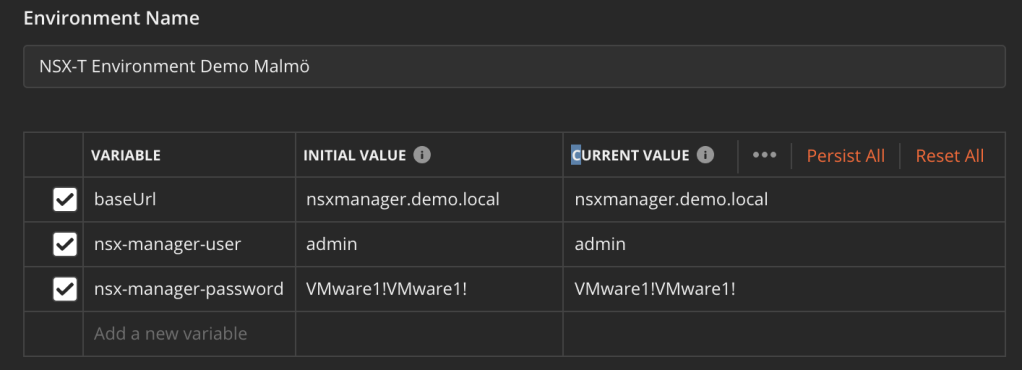
Give the environment a name and add the following variables:
Variable
Value
baseUrl
your-nsx-manager-fqdn
nsx-manager-user
your-nsx-manager-user
nsx-manager-password
your-nsx-manager-password
In Postman:
Step 3 – Download the NSX-T OpenAPI specifications
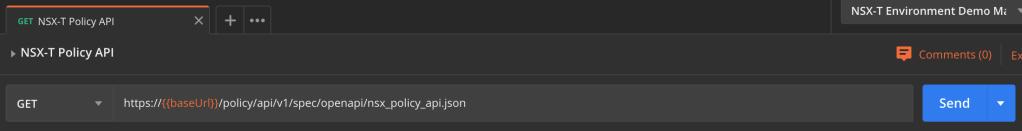
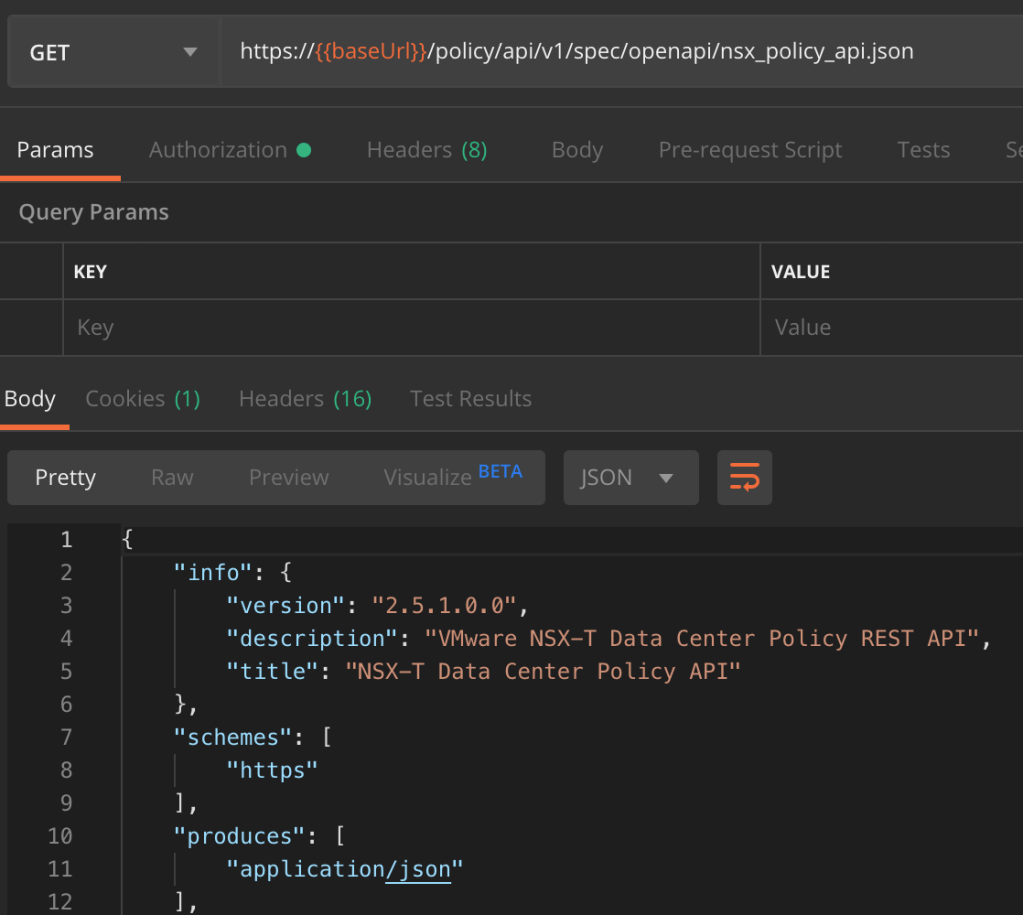
Both the Manager API and the Policy API are described in the OpenAPI format. You can download their specifications using a GET request.
We immediately make use of the “baseUrl” environment variable. Don’t forget to select the environment (in the top right corner) so that Postman knows where to fetch it’s value.
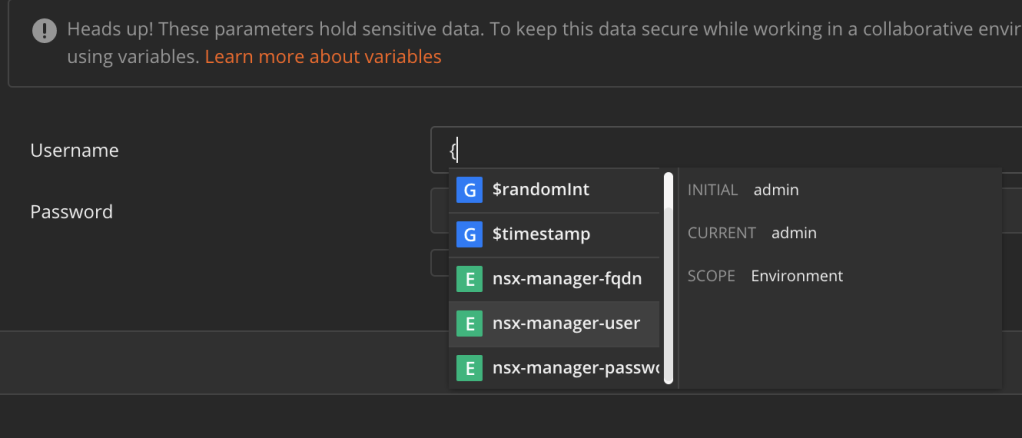
We also need to authenticate when connecting to the NSX-T API. This is configured under “Authorization“. Select “Basic Auth” from the “Type” list. Instead of entering the NSX-T credentials in the Username and Password fields, you type a “{” and select the “nsx-manager-user” variable from the list that pops up:
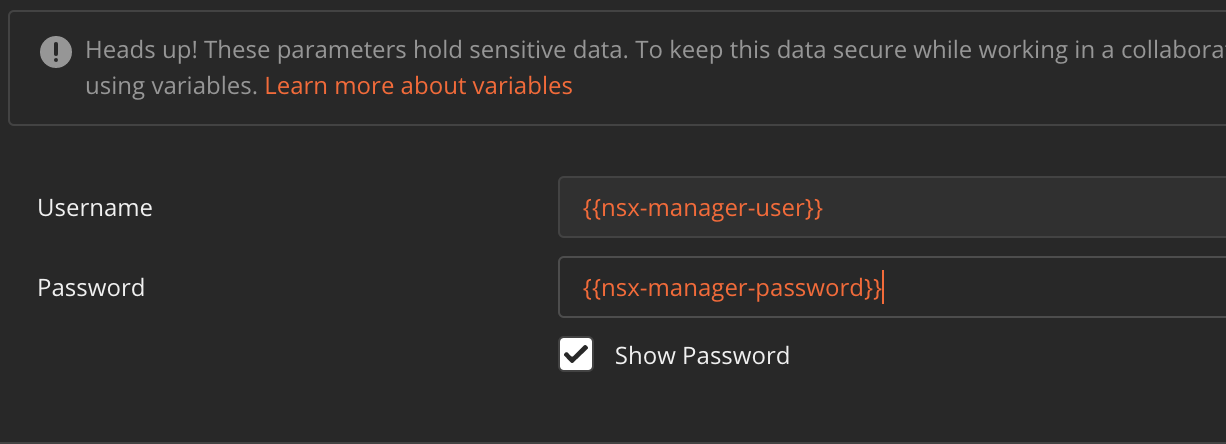
Tick the “Show Password” box and then repeat this “trick”, but now select the “nsx-manager-password” variable instead:
Click the Send button to fetch the OpenAPI specifications.
Step 4 – Import the NSX-T OpenAPI specifications
The specifications are downloaded and available in the body of the GET requests:
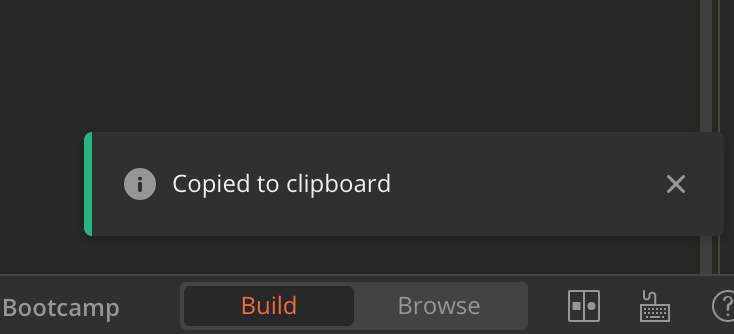
Copy the contents of the request body by clicking on the two overlapping squares icon in the right corner and wait until it says “Copied to clipboard“:
Next, click the “Import” button in the upper left corner of the Postman application window and select “Paste Raw Text“. Paste the contents of the request body into the text box and then click the “Import” button:
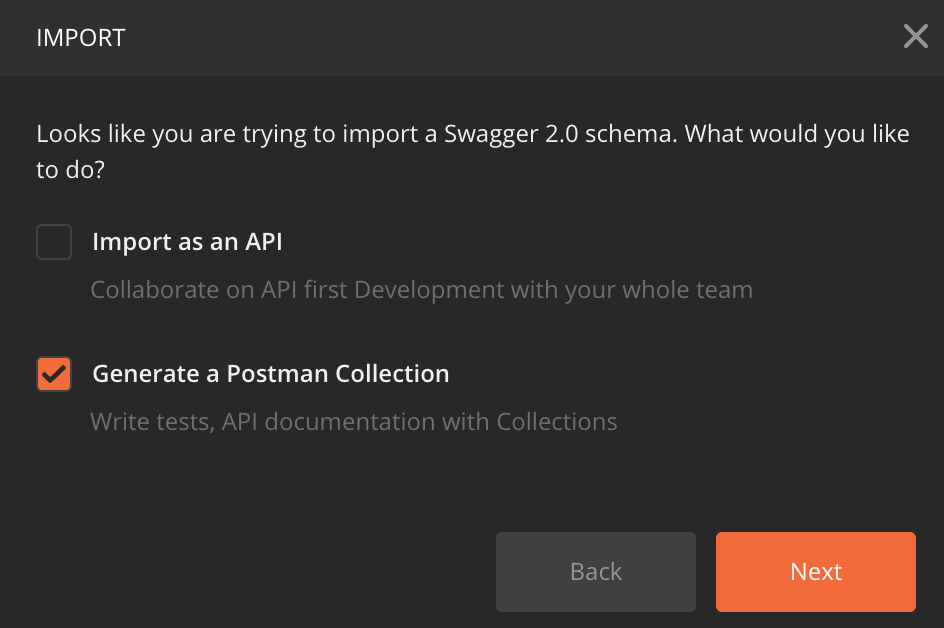
In the dialog that pops up make sure that you only select “Generate a Postman Collection” and click “Next“:
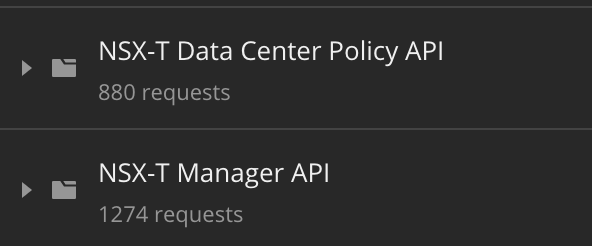
After a couple of seconds you should see a new collection in Postman. For the Manager API the collection is called “NSX-T Manager API” and for the Policy API the collection is called “NSX-T Data Center Policy API“:
Step 5 – Configure Authorization
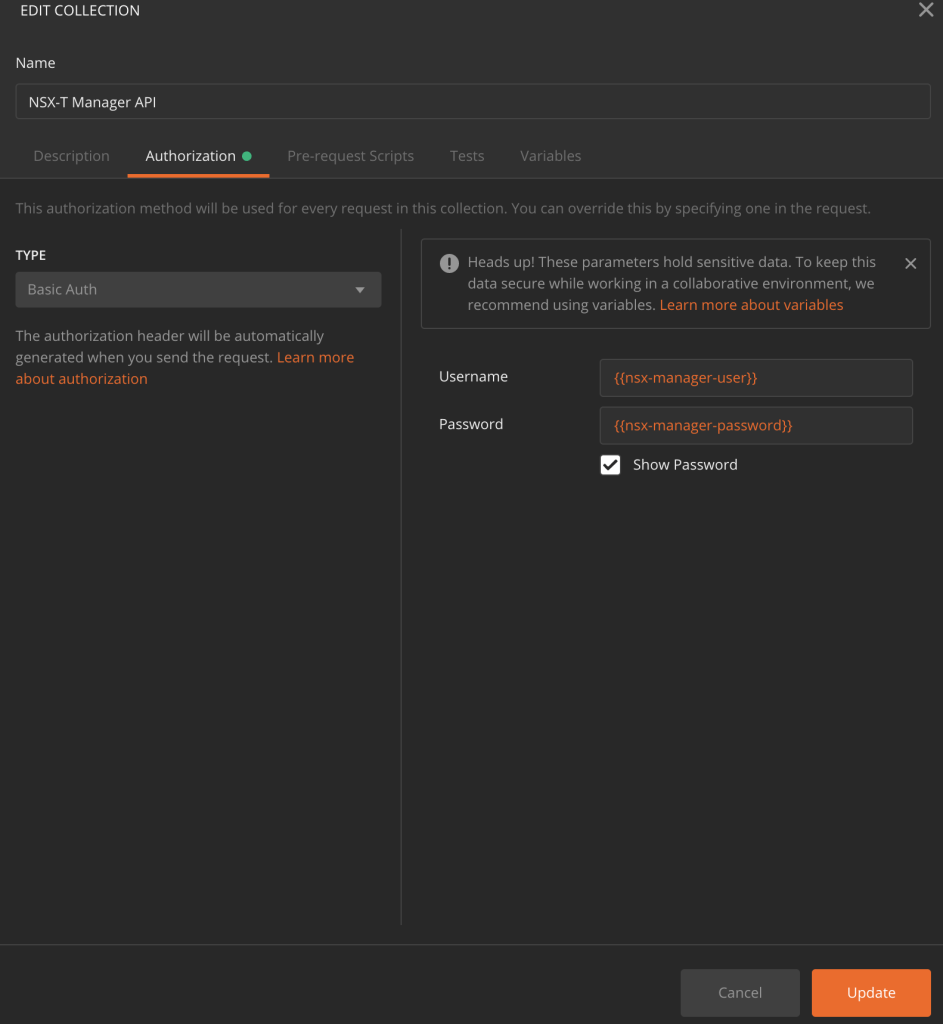
We also want all of the API requests in the collections to perform basic auth using the “nsx-manager-user” and “nsx-manager-password” variables that we defined in the Postman environment. This is configured at the collection level.
For each collection right-click and select “Edit“:
Click the “Autorization” tab and select “Basic Auth” from the “Type” list. Enter “{{nsx-manager-user}}” for “Username” and “{{nsx-manager-password}}” for “Password“. Click the “Update” button to save the changes:
The requests within the collections will now use these “parent” authorization settings.
Conclusion
It takes some minutes, but now that everything has been set up it will be less of a hassle to get started.
Who knows, next time when you need to configure or deploy something in NSX-T you might be doing it using one of the NSX-T API requests in Postman. 😉
NSX tags on virtual machines often play a fundamental role in a NSX micro-segmentation security framework. Tags are used as the criteria for security group membership which in turn are used as source or destination in distributed firewall policy rules.
Tagging virtual machines in NSX-T can be done in a number of ways. We essentially have two interfaces to work with; the API and the UI.
VM tagging via the API
The API documentation explains how we can send a request to /api/v1/fabric/virtual-machines?action=update_tags. A POST request with the following request body will assign the tag “scope: os” and “tag: linux” to a particular virtual machine (identified by the external_id).
Similarly, we can fetch the currently assigned NSX-T tags by sending a GET request to /api/v1/fabric/virtual-machines. Use the display_name and included_fields parameters to narrow down the result:
It’s important to understand that when tagging virtual machines through the API directly, existing virtual machine tags are replaced with the ones specified in the request body.
VM tagging in the UI
Tagging virtual machines in the NSX Manager UI is very straight forward. Under Inventory > Virtual Machines you click the three vertically aligned dots in front of a virtual machine and choose Edit:
You can now start adding tags which consist of an optional value for Scope and a mandatory value for Tag. Click Save when done.
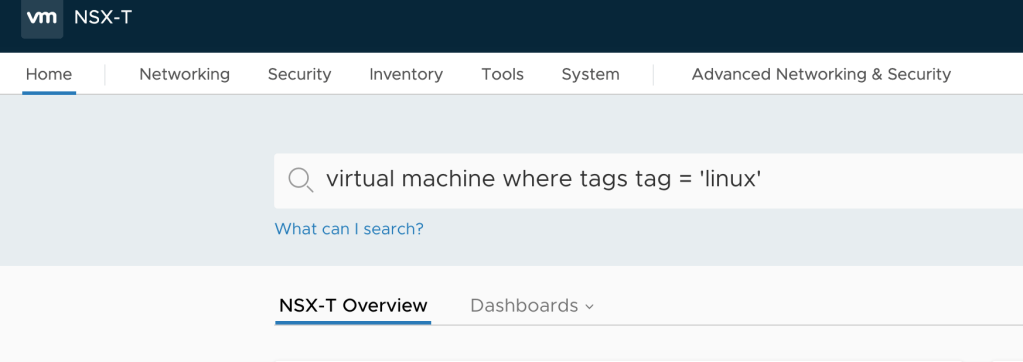
Tip: If you want to list virtual machines with a certain tag you can make use of the natural language search capability in NSX Manager. For example you can write something like this in the global search bar: virtual machine where tags tag = ‘linux’
The Challenge
All good and well, but as you probably noticed assigning NSX-T tags in one of these ways is done on a per virtual machine basis.
This is problematic in an enterprise environment with thousands of virtual machines where large scale tagging operations are a requirement. Imagine a micro-segmentation project where large groups of virtual machines need to be zoned and isolated based on tags (OS tags, tier tags, business group tags, etc). You can’t start doing this per VM and still expect to meet your project’s deadline.
And then tagging via the REST API directly using a tool like Postman has the additional problem that it replaces existing tags so extra care needs to be taken to ensure the desired result.
The Solution
So, it’s pretty obvious that large scale tagging of virtual machines in NSX-T isn’t supposed to be done using the methods mentioned above.
Instead you could let some automation/orchestration tool take care of it. Terraform’s NSX-T provider can do it without too much hassle by using the nsxt_vm_tags resource. There are probably others.
In short, if you have some developer skills you will probably have little trouble putting together something that does virtual machine tagging for you in a satisfying way.
Me
I’m not a developer and I also don’t feel like introducing a new automation/orchestration solution just to be able to bulk tag virtual machines for an NSX-T micro-segmentation project (although I really like Terraform).
Bound by these self-inflicted constraints I’m left with scrambling together bits and pieces and try to make the best out of it.
A PowerShell script
This is more or less the reason behind the little PowerShell script nsxt_add_vm_tag.ps1 seeing the light of day. Combining PowerCLI and the NSX-T REST API to get the task done:
After gathering the values for some variables including the $newtag and optionally $newscope, the script starts with some PowerCLI to query vCenter for the virtual machines that should be added to the scope:
Criteria can of course be added to Get-VM to narrow the result to VM names, VM folders, VMs with certain vSphere tags, and so on.
Next we enter a ForEach loop where the magic is performed. The InstanceUuid is extracted for each virtual machine. This is used by NSX-T where it’s called external_id:
foreach ($vm in $vms) {
    $vmid = $vm.Config.InstanceUuid
The whole goal here is to add tags, not replace existing ones. The part below gets hold of the currently assigned tags. Some regex matching is used to polish the data so it contains just the relevant parts:
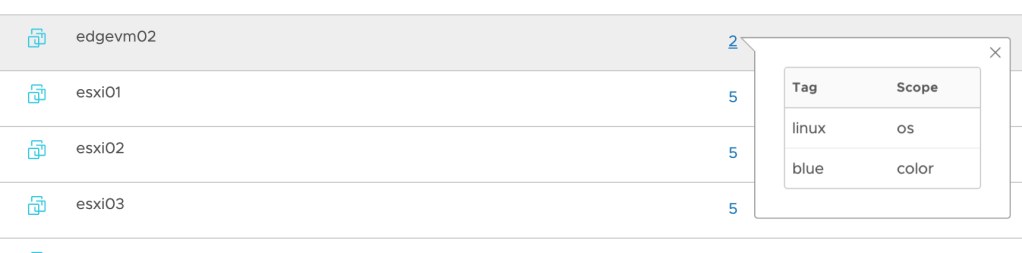
And the result in NSX Manager shows that the new tag is added while the existing tag is still there:
Conclusion
Beautiful, right? No, but it seems to accomplish the simple task of adding NSX-T tags to a large number of virtual machines in one sweep.
I’ve uploaded this script to Github so you can easily access it. I’m sure it can be improved in many ways and I encourage you to do so!
A final word. There might me different and better approaches to achieve the same result. If you know of one I would be very interested to learn more about it so please let me know 🙂
One of the first things to configure after deploying the NSX Manager nodes is backup. No NSX-T implementation should ever get configured let alone go live without a working backup (and restore) in place.
Let’s have a look at how to set this up.
Backup target
NSX-T uses SFTP (TCP port 22) to transfer backup files to a backup target running an SFTP server. A Linux machine fits quite nice for this purpose simply because the (nearly) builtin SSH service makes it very easy to set up.
In this article I’m using Ubuntu 18.04, but you can basically use any Linux distribution that you prefer. I won’t go through the Ubuntu OS installation steps in this article. In short, you perform a standard Ubuntu server installation and add/enable the OpenSSH server.
Configuration
Once the Ubuntu server is up and running we need to spend some minutes on configuring it as a proper NSX-T backup target.
We want to use a dedicated service account for the NSX-T backup and restore operations. This account shouldn’t be able to do more than log in via SFTP and write NSX-T backup files to a directory.
To achieve the SFTP restriction we install a package called Restricted SSH (rssh). On Ubuntu that package is installed the ordinary way:
sudo apt install rssh
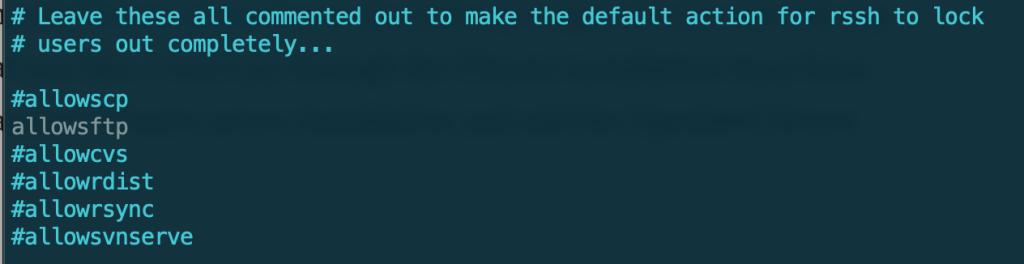
We then need to make one change in /etc/rssh.conf:
sudo nano /etc/rssh.conf
Accounts using the rssh shell should be allowed to login via SFTP and SFTP only. So we need to uncomment allowsftp. Save the file when done.
Next we create the service account itself:
sudo useradd -s /usr/bin/rssh nsx-backup
The “-s” parameter specifies that the account will use rssh as its shell.
Set a (strong) password for the service account:
sudo passwd nsx-backup
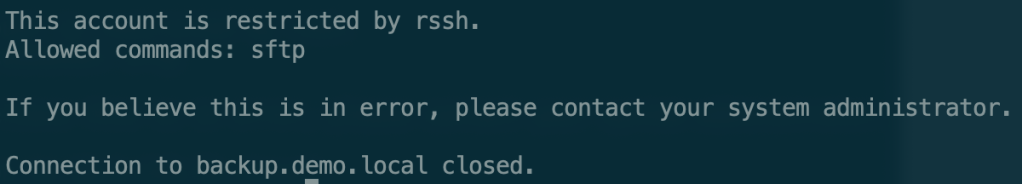
To verify that the rssh restriction is working for the service account you can try to login with SSH:
ssh nsx-backup@backup.demo.local
As you can see SSH access is not allowed (restricted by rssh).
The last thing we need to configure is a directory where the NSX-T backups will be stored. I also modify the permissions so that the service account can write to the directory:
sudo mkdir /backup
sudo chmod -R 757 /backup
Now that all the necessary configuration on the backup target is in place we can tighten security by allowing only the NSX Manager nodes and maybe a jump host to access the server on port 22. For example:
sudo ufw allow from 10.2.129.12 to any port 22
sudo ufw allow from 10.2.129.13 to any port 22
sudo ufw allow from 10.2.129.14 to any port 22
sudo ufw allow from 10.2.129.15 to any port 22
sudo ufw enable
Alternatively (or additionally) you could use the NSX-T DFW to restrict access.
NSX-T backup configuration
The NSX-T backup can be configured in the NSX Manager UI or via the API. Let’s have a look at both.
Configuration using the UI
Log in to NSX Manager:
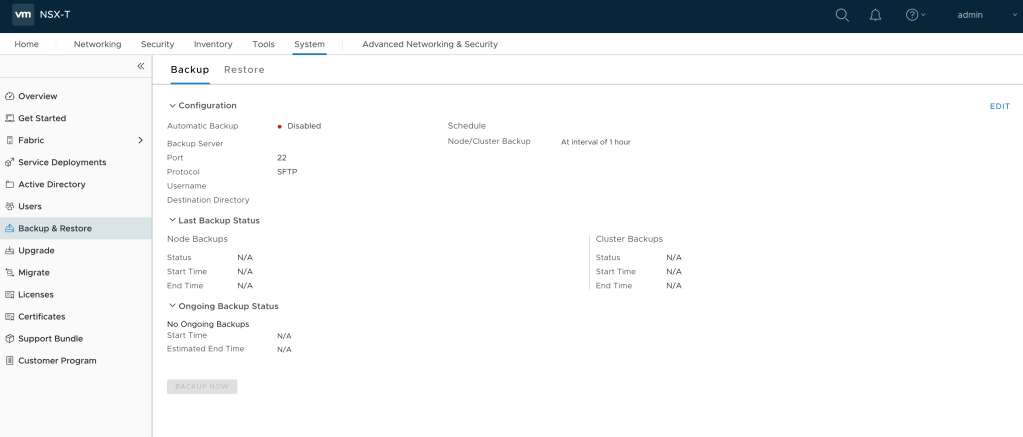
Navigate to System > Backup & Restore:
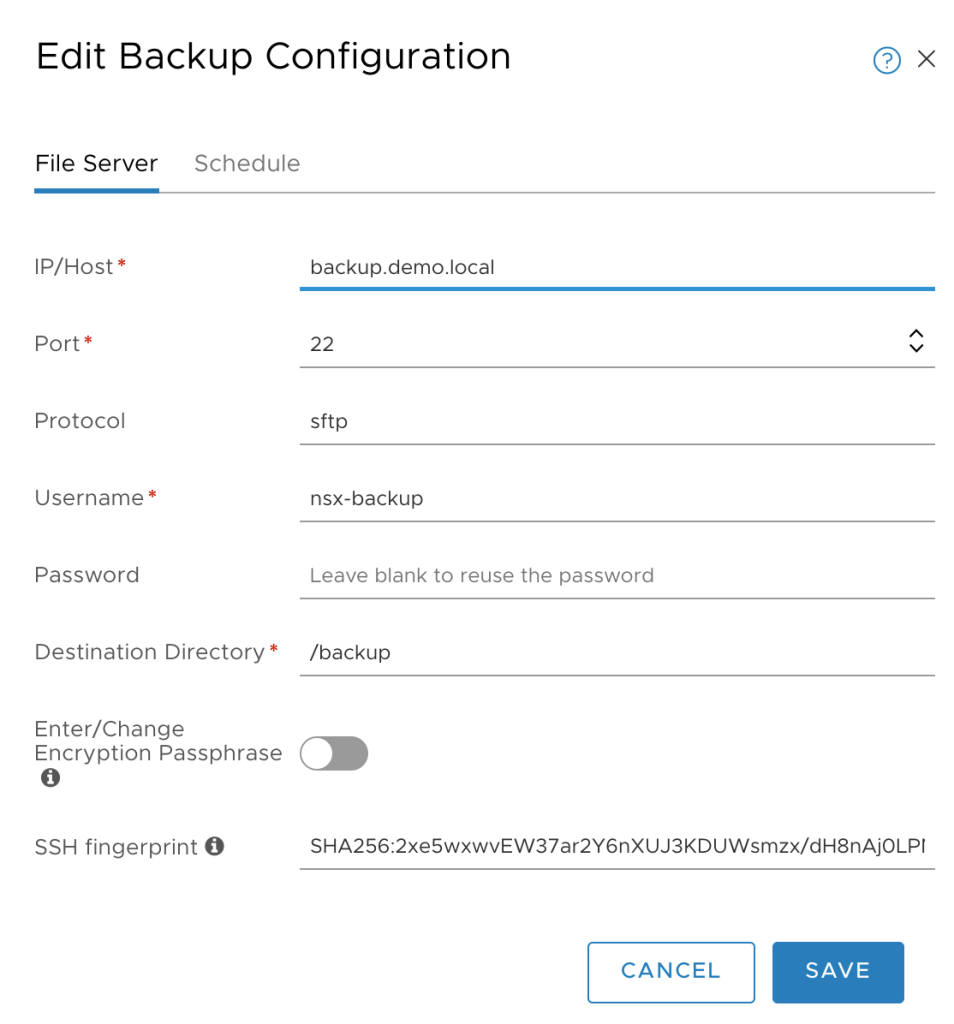
Click Edit in the upper right of the page and fill out the details for the backup target:
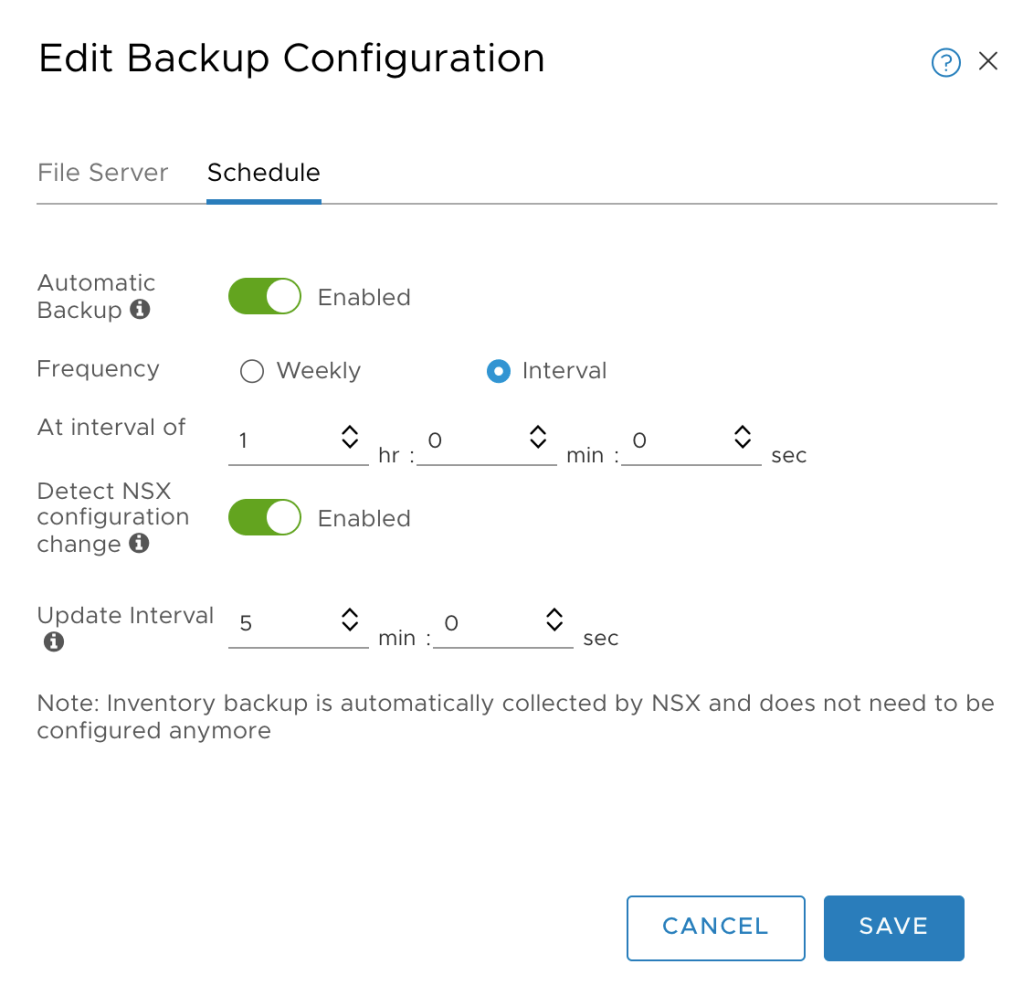
Click the Schedule tab:
Enable Automatic Backup and adjust the interval according to your requirements. Optionally you can enable Detect NSX configuration change which triggers a full backup each time a configuration change is detected by NSX Manager.
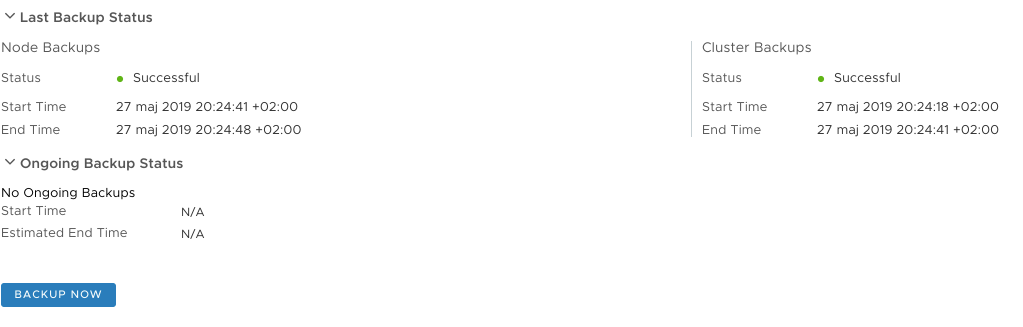
After hitting the Save button a backup process is fired off immediately which gives us the opportunity to verify that everything is working. Hopefully node and cluster backups are successful:
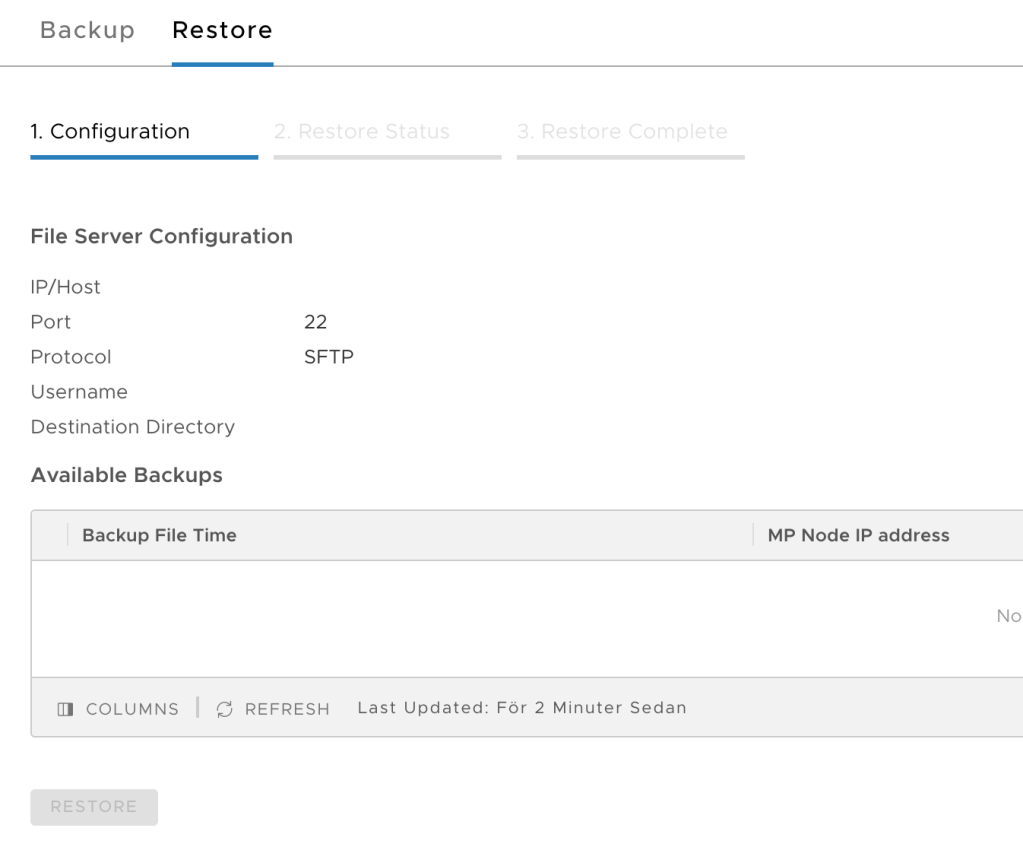
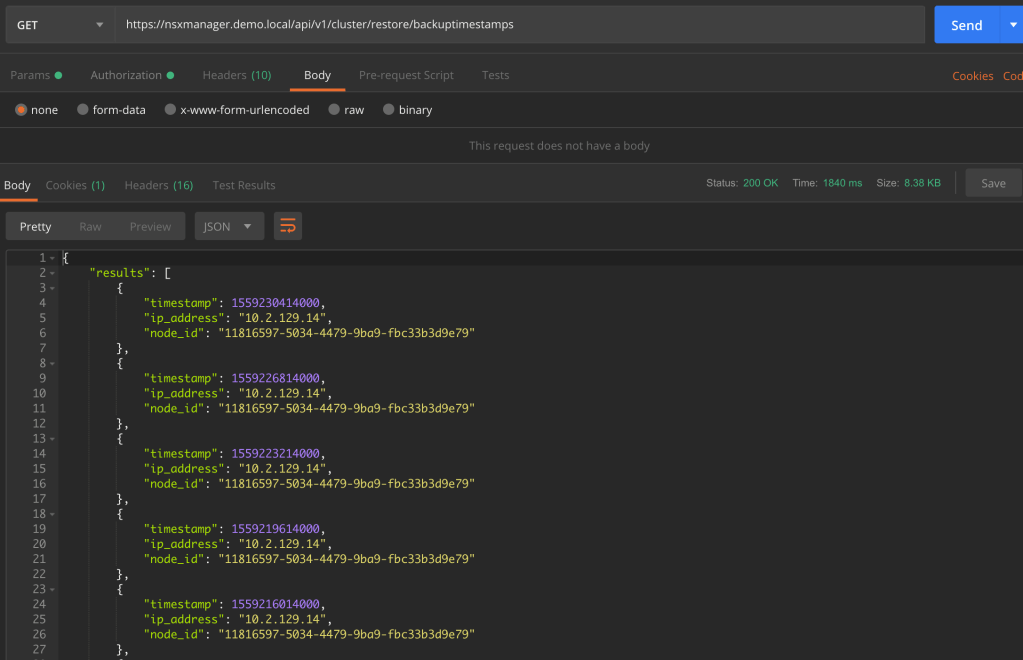
While we’re here we should also configure the backup target details under the Restore tab so that this is in place when we need it:
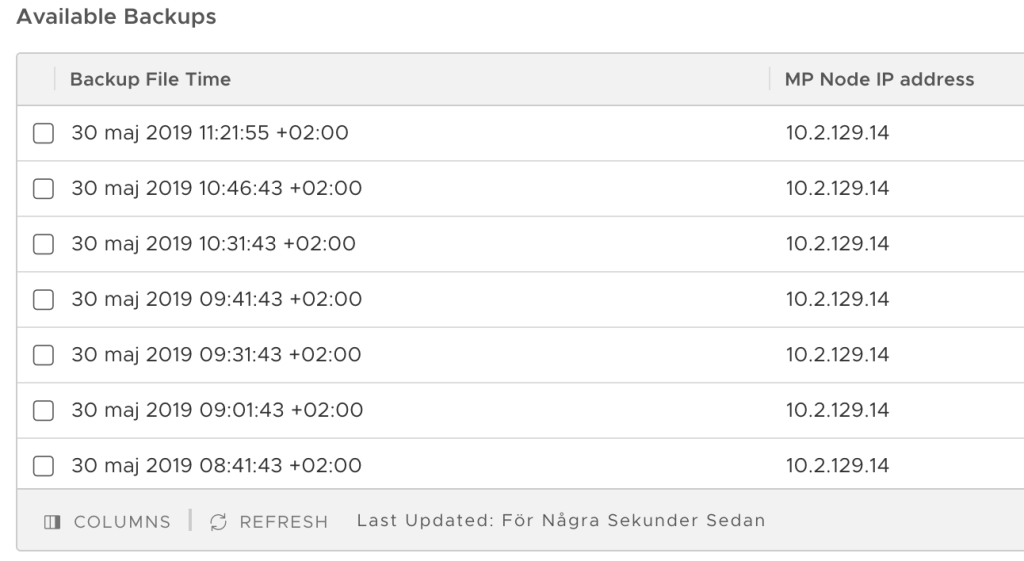
After filling out the details of the backup target and hitting the Save button, the list with available backups is updated and available backups are shown:
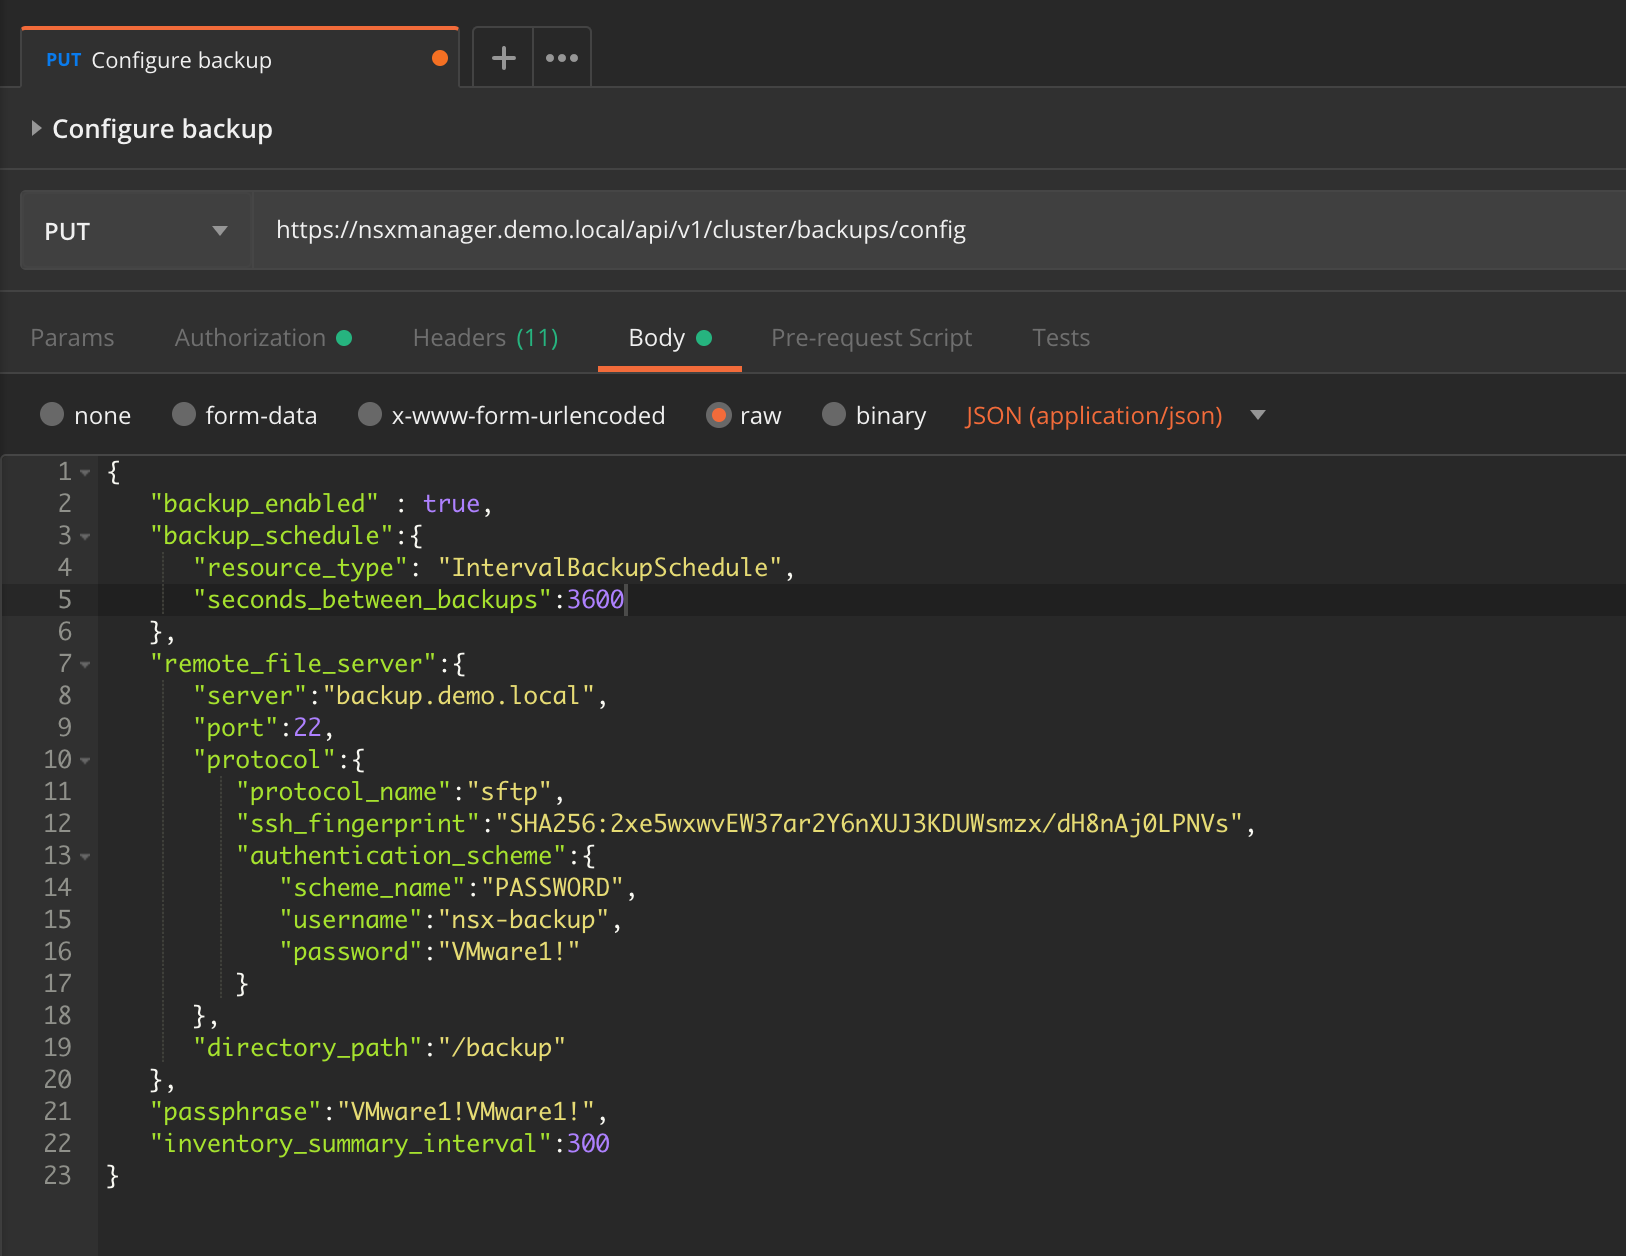
Configuration via the API
The same configuration can be done via the NSX-T API.
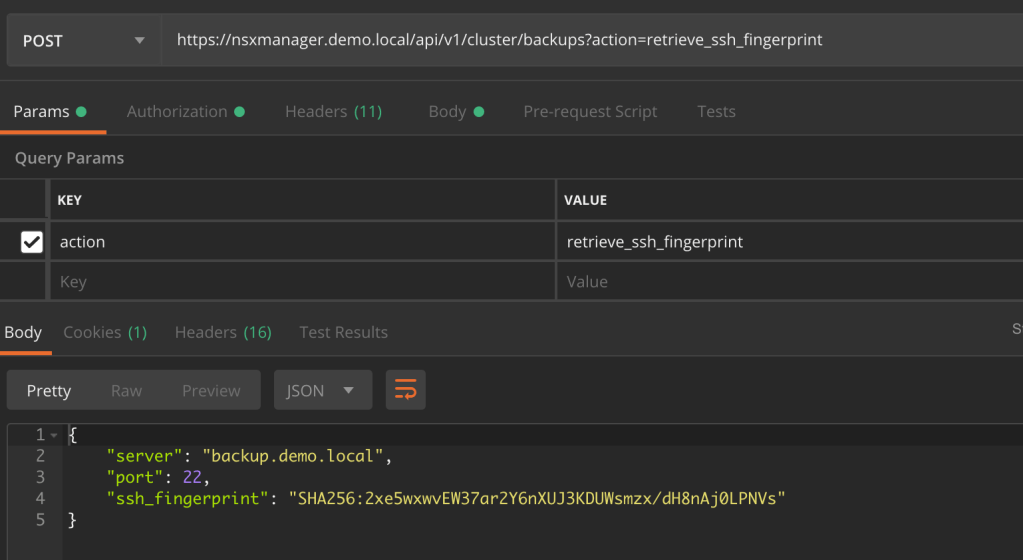
SHA256 fingerprint
First we need to fetch the SHA256 fingerprint of the SFTP backup target. Use the following JSON code:
{
     "server":"backup.demo.local",
     "port":22
  }
Send this code as the body of a POST request to the API at:
NSX-T follows the API-First approach and the entire platform including everything concerning backup and restore can be managed through the API. Check out the NSX-T API documentation for more details.
Retention
Unfortunately, there is no builtin backup retention in NSX-T like we have in the vCenter VAMI. What we have is a Python cleanup script that we can run on the backup target to clean up old backups.
30 days retention example
To set up a 30 day retention period for NSX-T backups follow these steps:
1 – Copy the Python script from an NSX Manager node to the backup server. Using SCP for example:
The script will run once a day, iterate through the NSX-T backups and delete the ones that are older than 30 days.
Conclusion
A working NSX-T backup is a critical component of every NSX-T platform. Luckily setting this up is a straight forward process.
There is always room for improvement. Support for some more file transfer protocols and builtin retention management would be nice. We might see something happening around this in future releases of NSX-T.
For Role Based Access Control (RBAC) in NSX-T we need to configure integration with VMware Identity Manager.
There’s an excellent VMware blog post that explains in detail how to set up vIDM and how to configure the integration in NSX Manager.
The problem
When setting this up myself I ran into a small problem that stopped me from completing the configuration.
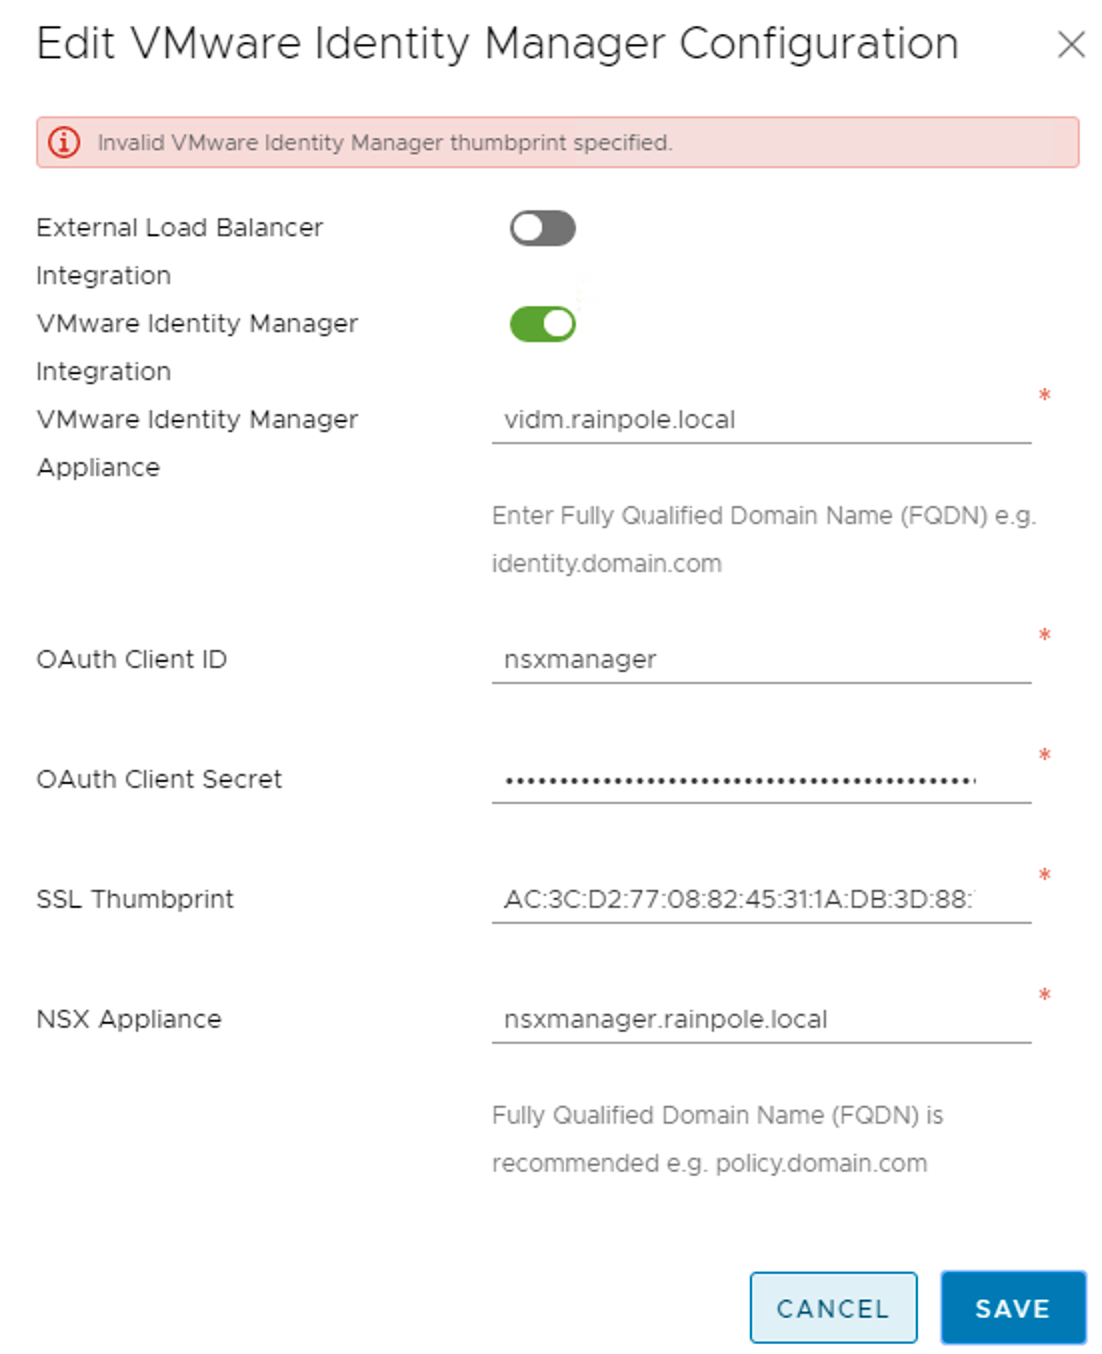
When I tried to add the vIDM configuration in NSX Manager I received an error:
“Invalid VMware Identity Manager thumbprint specified.”. That’s very strange as that is the correct thumbprint. I checked it once more from the vIDM CLI:
It definitely is the same thumbprint. What’s going on here?
Troubleshooting
Then it hit me that I had replaced the vIDM’s default self-signed SSL certificate with a CA-signed certificate signed as per the vIDM documentation. Could it be that the “vidm.rainpole.local_cert.pem” file was not replaced during that process and in fact still is the default self-signed certificate? I had a closer look at that PEM file:
Ouch! This is indeed the default self-signed certificate. No wonder NSX Manager doesn’t like the thumbprint. It doesn’t correspond to the active vIDM appliance SSL certificate.
The solution
To get the actual certificate fingerprint I ran the following command from my jump host:
And there it was! I pasted the fingerprint into the NSX Manager’s vIDM configuration, hit Save and the thumbprint was accepted:
Lesson learned
Do not log in to the vIDM appliance CLI to get the SSL certificate thumbprint. Instead let openssl connect to the vIDM web server to fetch the thumbprint of the active SSL certificate and you know you’re good.
Back in February VMware announced version 2.4 of NSX-T calling it a “landmark release in the history of NSX”. The new and enhanced features introduced in version 2.4 are indeed impressive:
Converged NSX Manager appliance – bringing together management, policy, and central control services in one appliance with 3-node clustering support. Thus we now have high availability and a scale-out architecture for the management plane.
Simplified user interface – making configuration and administration of the NSX platform much intuitive.
A declarative policy model – specify your network and security requirements in a JSON file and send it to the API which will then deploy and configure all the necessary components to achieve the required outcome.
Advanced security features – L7 application context-based firewalling, identity-based firewalling, FQDN/URL whitelisting, guest introspection, and E-W service insertion.
Higher levels of scale, better performance – Bigger, better, faster.
With a “what’s new” list like this I have no other option than to upgrade my only weeks old 2.3 installation. Let’s see how that works out.
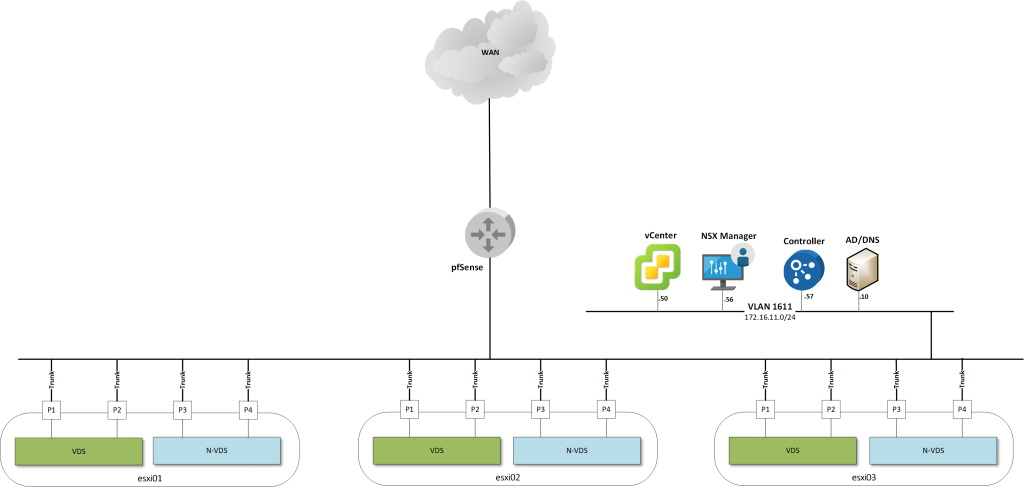
The lab environment
Just a quick recap of my lab environment in the form of some diagrams.
On a high level the environment looks like this.
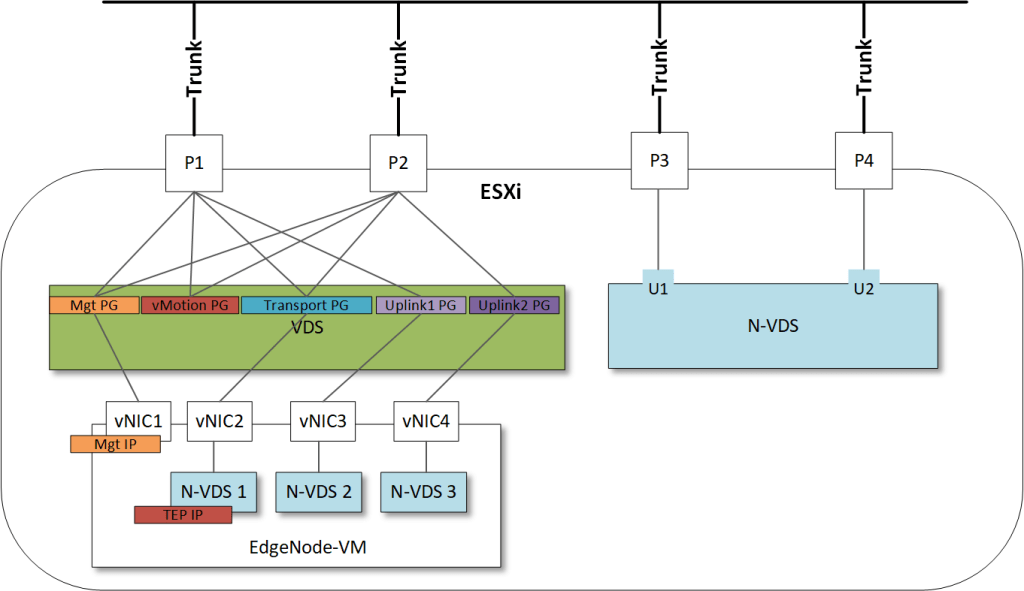
Zooming in on an ESXi transport node that is hosting an Edge VM:
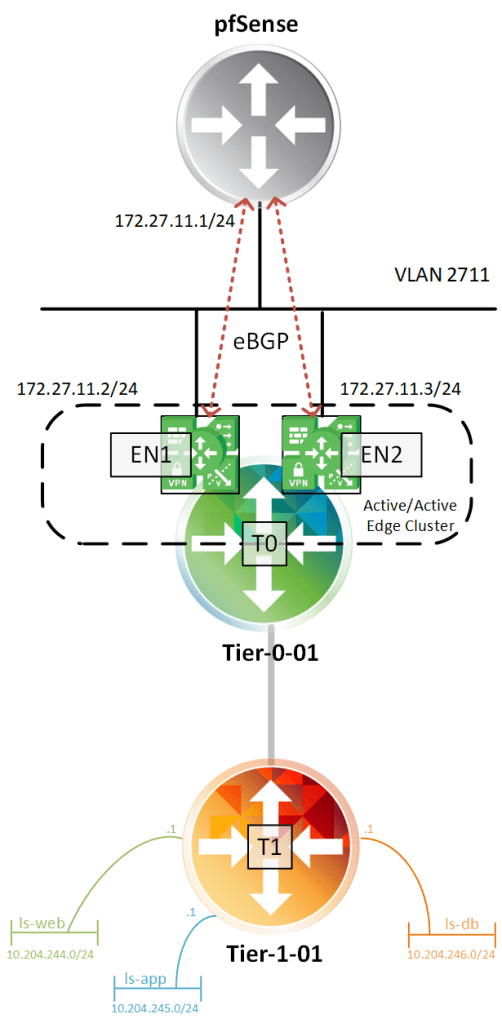
And finally the routing topology as I’ve configured it:
Most of the components are running in a nested environment.
The upgrade
VMware released an excellent upgrade guide which is a must-read if you’re about to upgrade to version 2.4. The upgrade checklist especially is a great resource for getting through the process and I highly recommend to follow it at all times.
Upgrade bundle
I start by downloading the 2.4 upgrade bundle which a 7,3 GB MUB package you fetch from VMware.com.
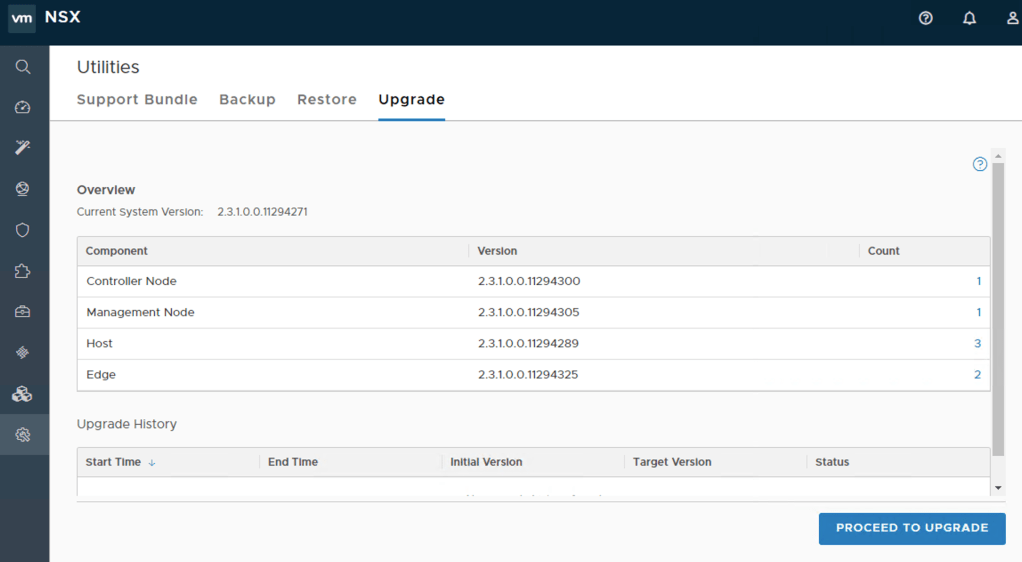
Once downloaded I log in to my NSX Manager and navigate to System > Utilities > Upgrade. On the landing page I see the different components and their current version. I click on the “Proceed to Upgrade” button:
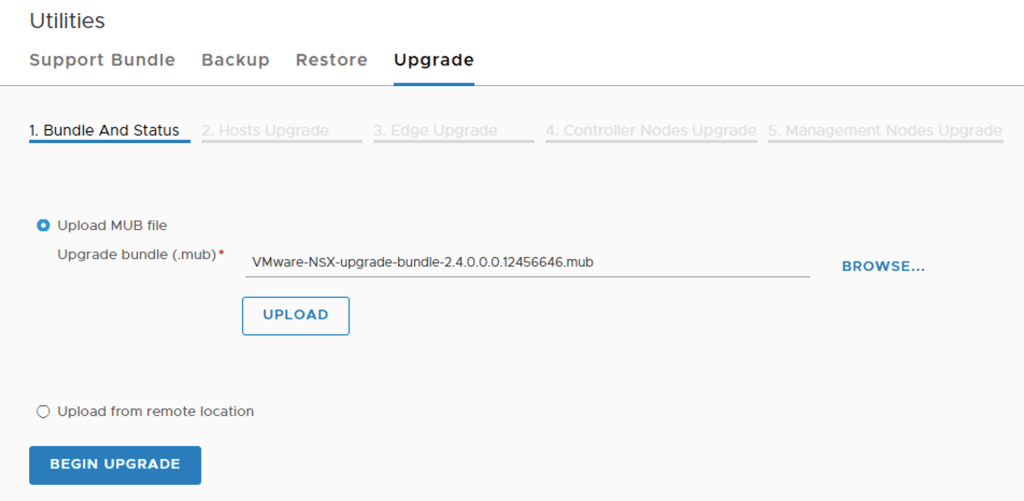
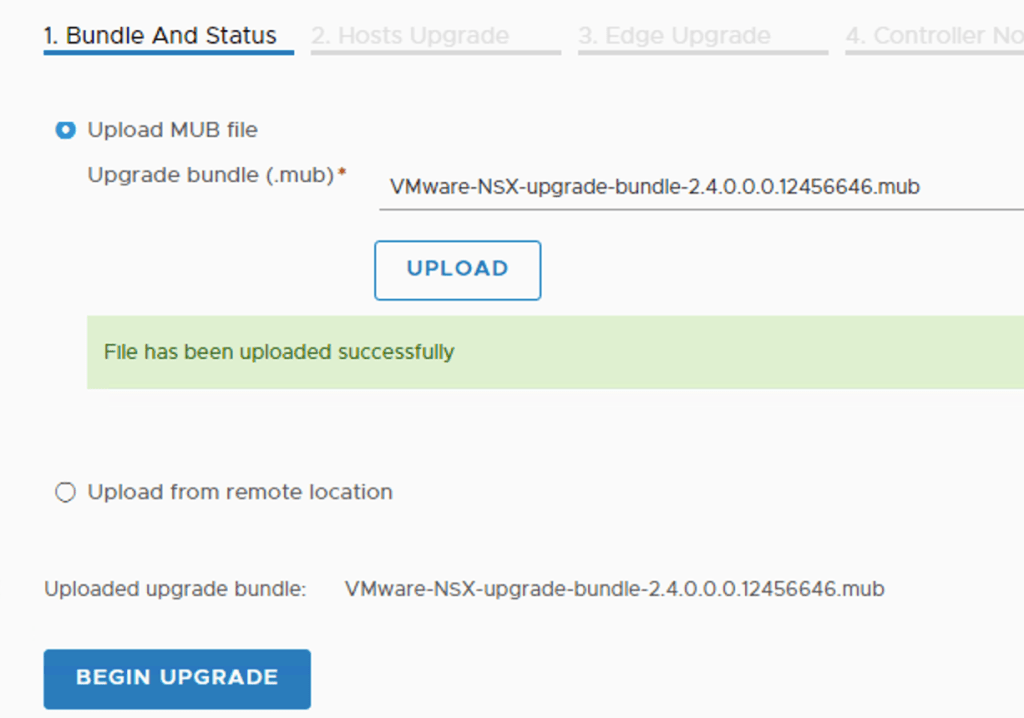
Under “1. Bundle And Status” I upload the MUB package:
The uploading and subsequently unpacking of the bundle will take some time.
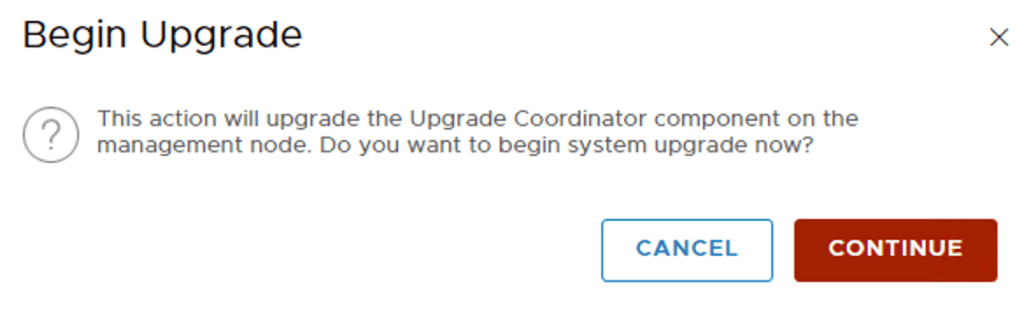
System upgrade
Once done I click on “Begin Upgrade”. I accept the license agreement (what else?) and start the system upgrade:
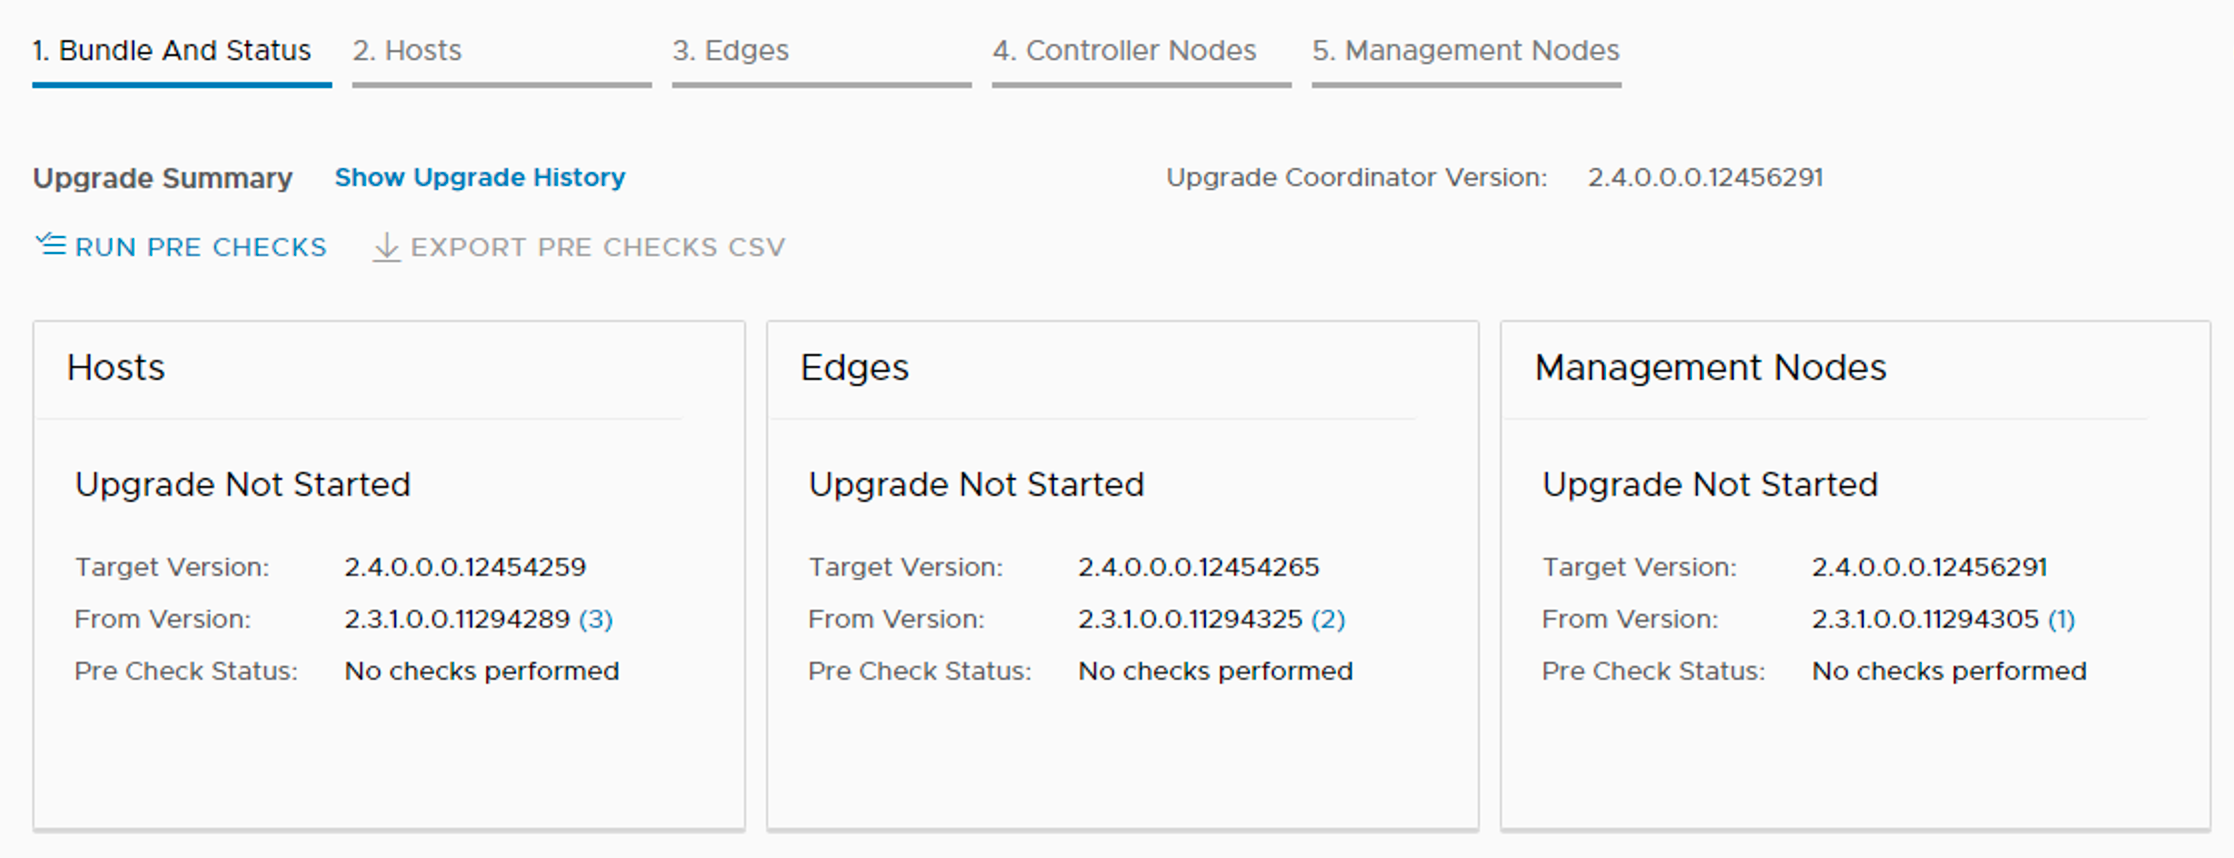
The upgrade coordinator gives me a clear overview and the option to run pre-checks to see if the different components are ready for an upgrade to version 2.4:
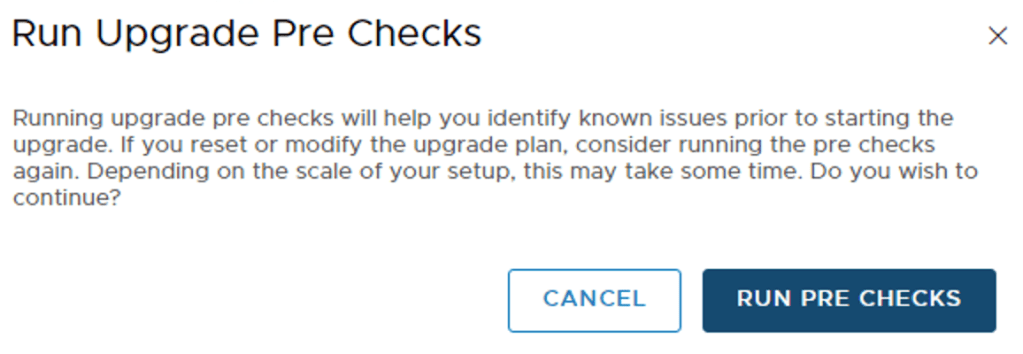
Running pre-checks is not mandatory, but highly recommended so I’ll do that:
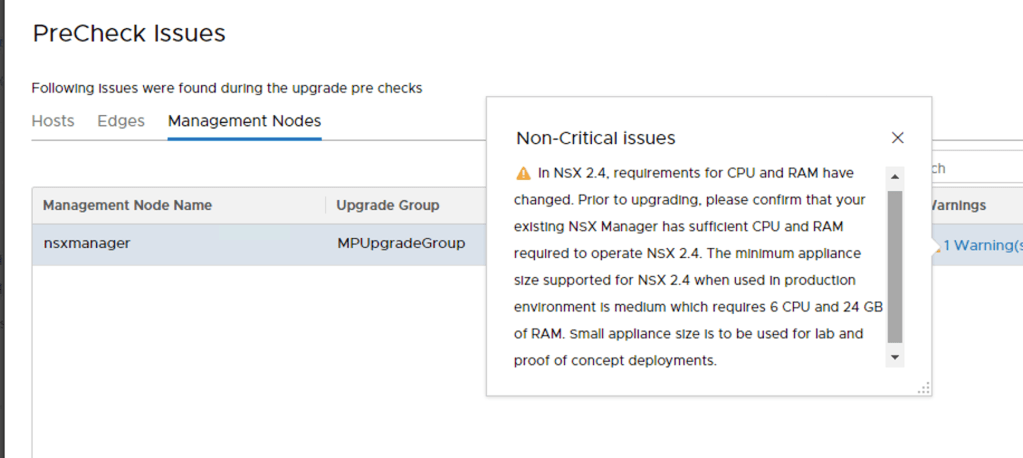
In my lab environment I received one non-critical issue on NSX Manager:
Well, this is a lab environment so I’m good here and will continue with the system upgrade.
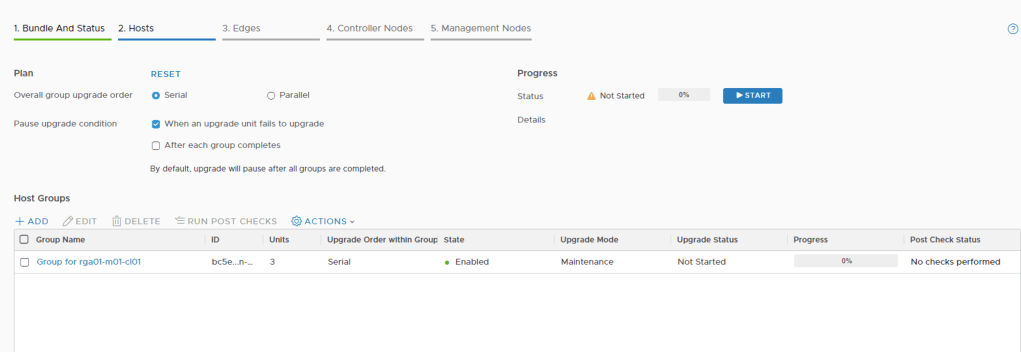
The upgrade coordinator starts with the (ESXi) hosts. Here we have some options:
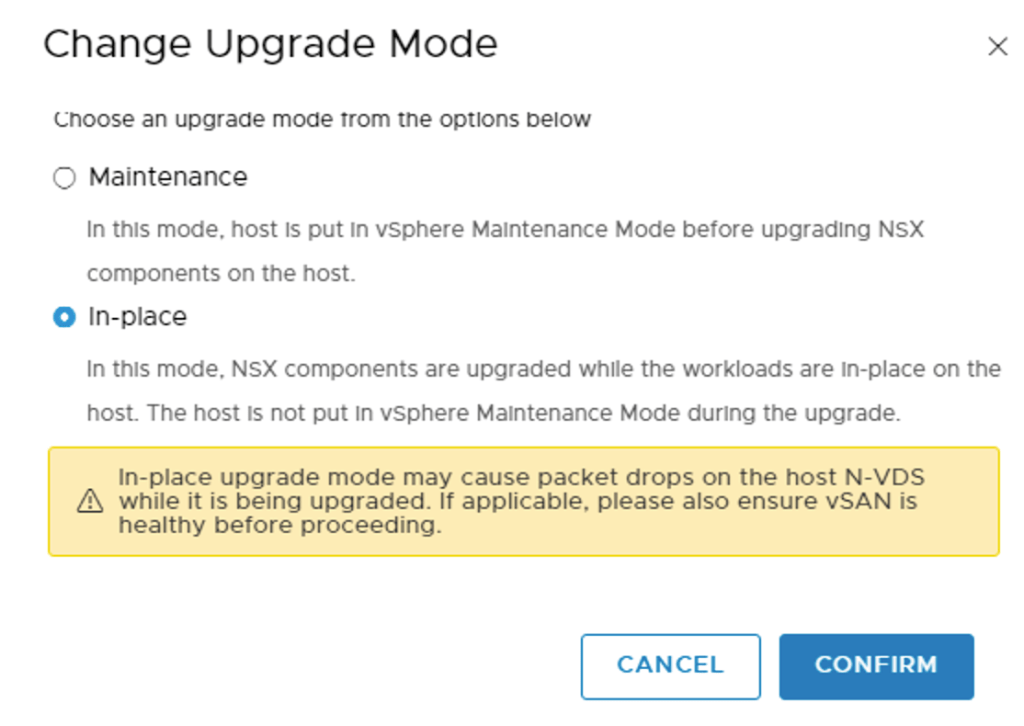
We can upgrade in serial or in parallel and decide for which conditions we want to pause the process. Under “Host Groups” I see that the coordinator has created a group containing the hosts in scope. Under Actions > Change Upgrade Mode I can decide which mode I want to use:
This is a lab environment so I’ll do an in-place upgrade. Notice the warning though and understand that “Maintenance” mode is a better fit for a production environment. I’m pretty happy with the defaults and click “Start” to fire off the upgrade of my hosts.
Once the hosts have been upgraded we should see a confirmation that everything went successful:
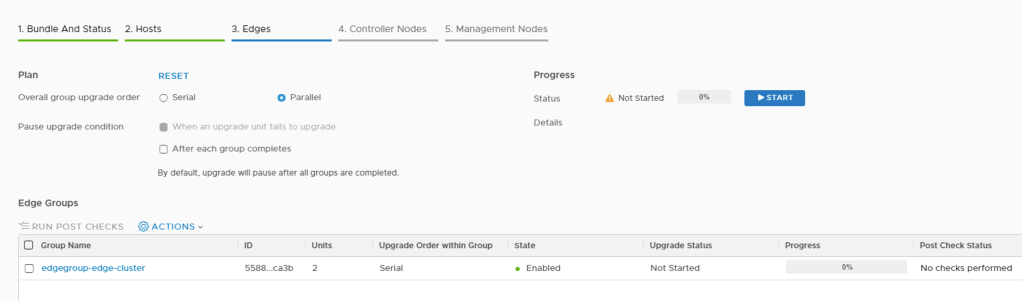
Clicking on “Next” brings me to “3. Edges” where I see more or less the same options as for the hosts.
The upgrade coordinator has placed my two Edge VMs in a group. The defaults look fine to me so I’m clicking “Start” to get the Edge VM upgrade process underway.
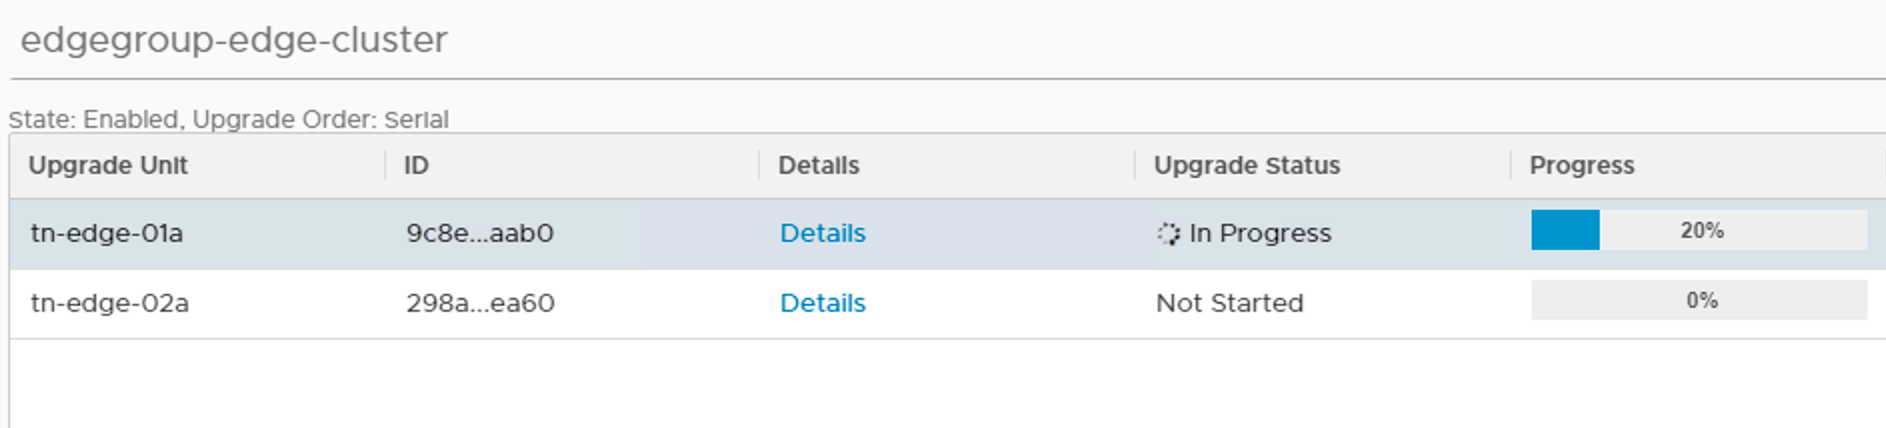
Clicking on the group you can see the installation progress per node:
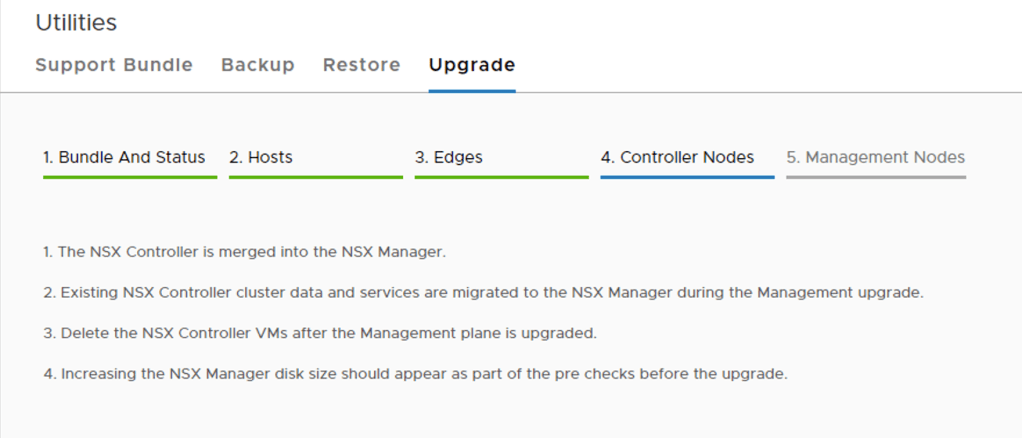
Once this is completed I click “Next” to proceed to “4. Controller Nodes”:
This is probably the quickest part in the upgrade process.
One of the architectural changes in NSX-T 2.4 is the convergence of manager, policy, and central controller services into one appliance. In other words we won’t be working with dedicated controller nodes anymore after the management plane upgrade. The existing controller nodes can simply be deleted after the upgrade.
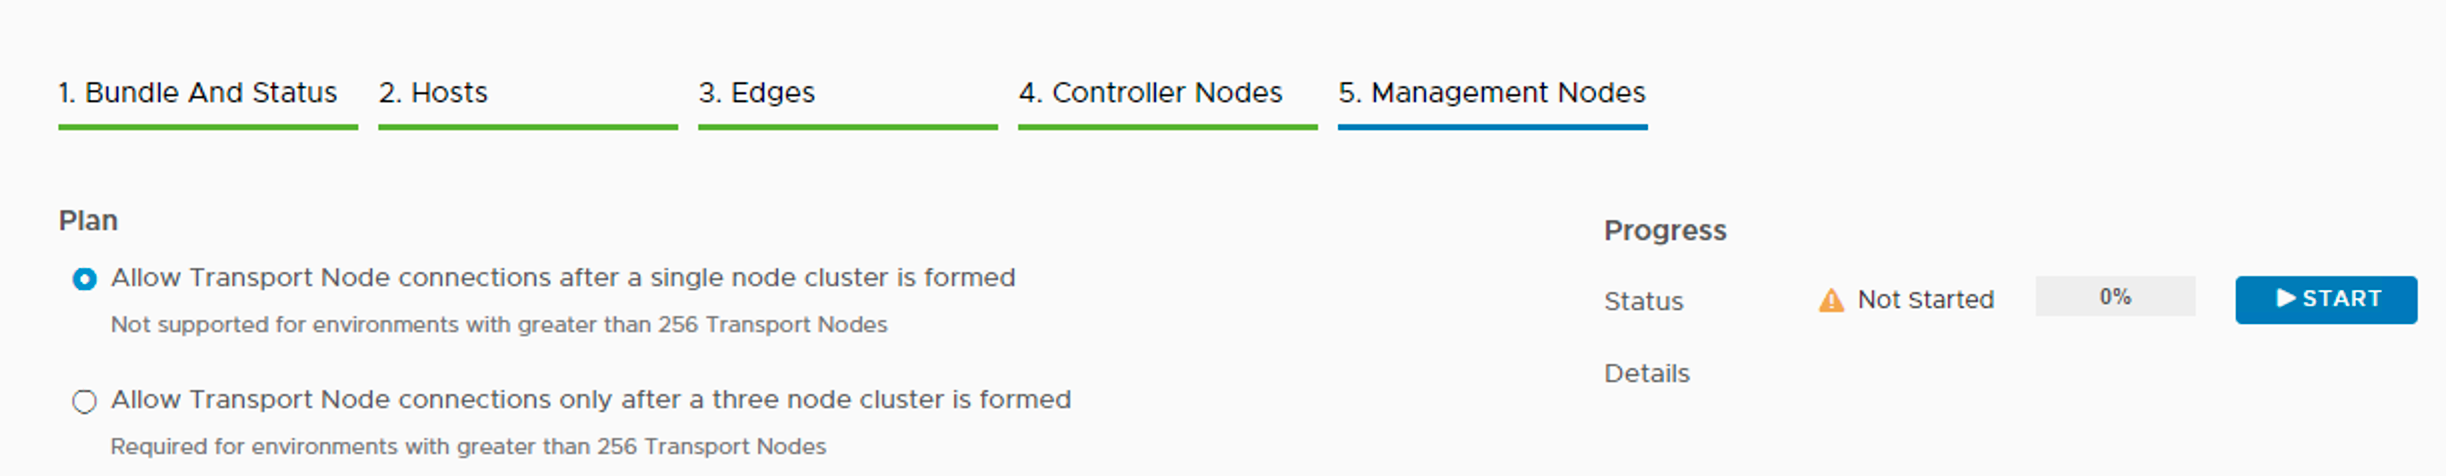
Clicking “Next” brings me to the “5. Management Nodes”:
The “Plan” here is to allow transport node connections after a single node cluster is formed. This is a lab and I’m happy with just one cluster node at this point. I can always add more nodes later on if I want to.
Not much else to look at here so I’m starting the upgrade of the management plane by clicking the “Start” button.
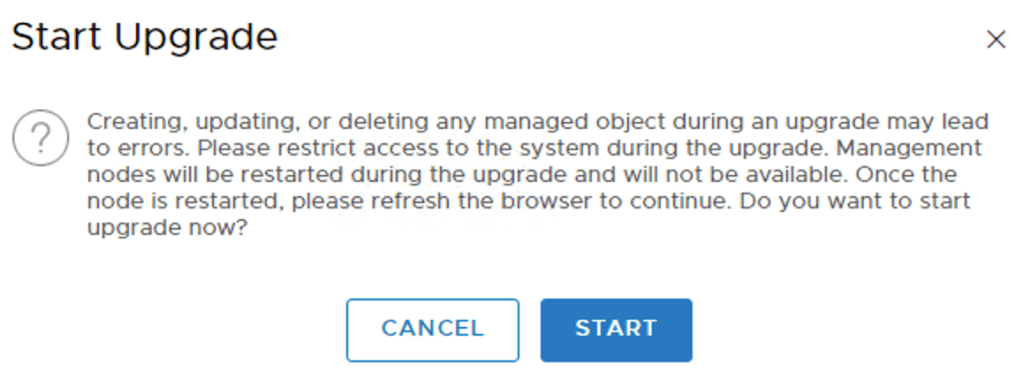
I’m not planning on doing any CRUD (create, update, delete) operations on managed objects during the upgrade so I click on “Start” (again):
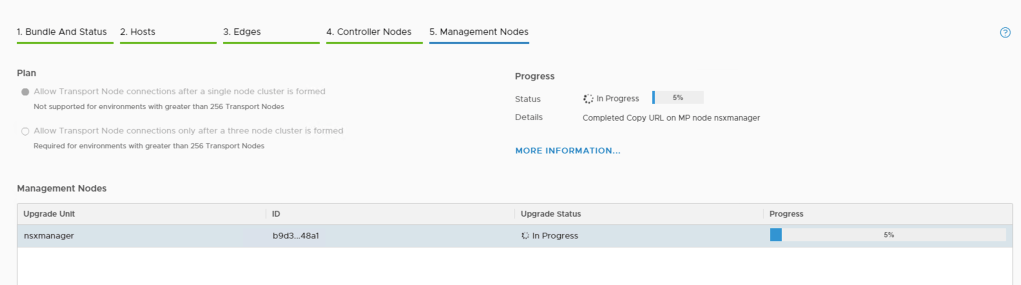
And the upgrade of the management plane is underway:
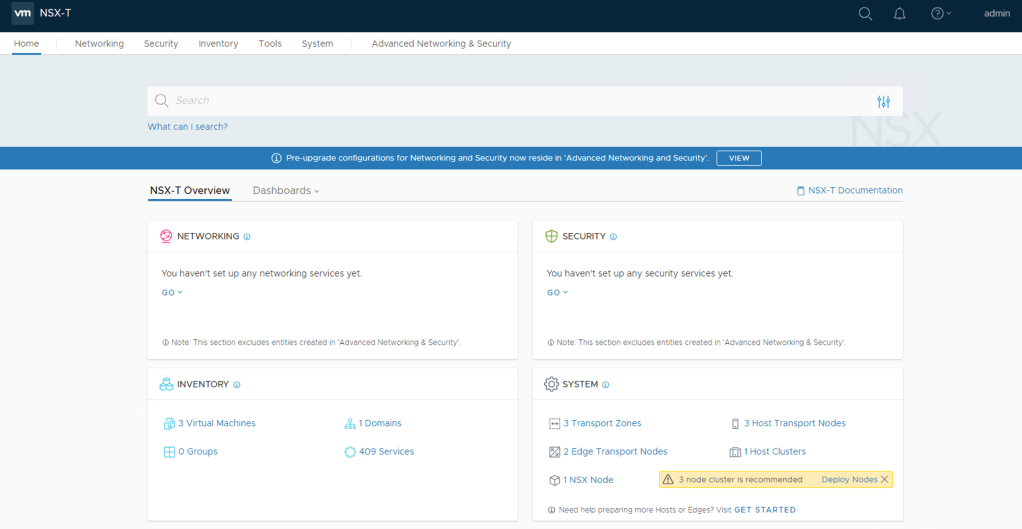
The node restarts as part of the upgrade so you will loose connection to the web interface at some point. Once the upgrade is completed you can log in again and will land on the new “NSX-T Overview” page:
Verification
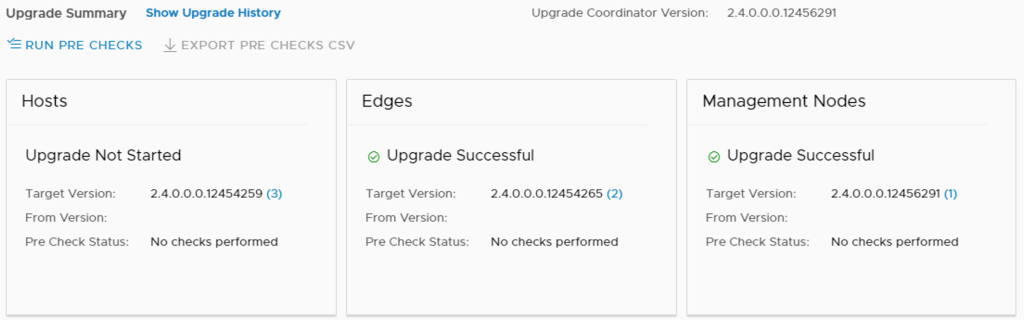
Let’s just verify that the upgrade completed successfully by going to System > Upgrade:
Things are looking good. It seems the upgrade was indeed successful.
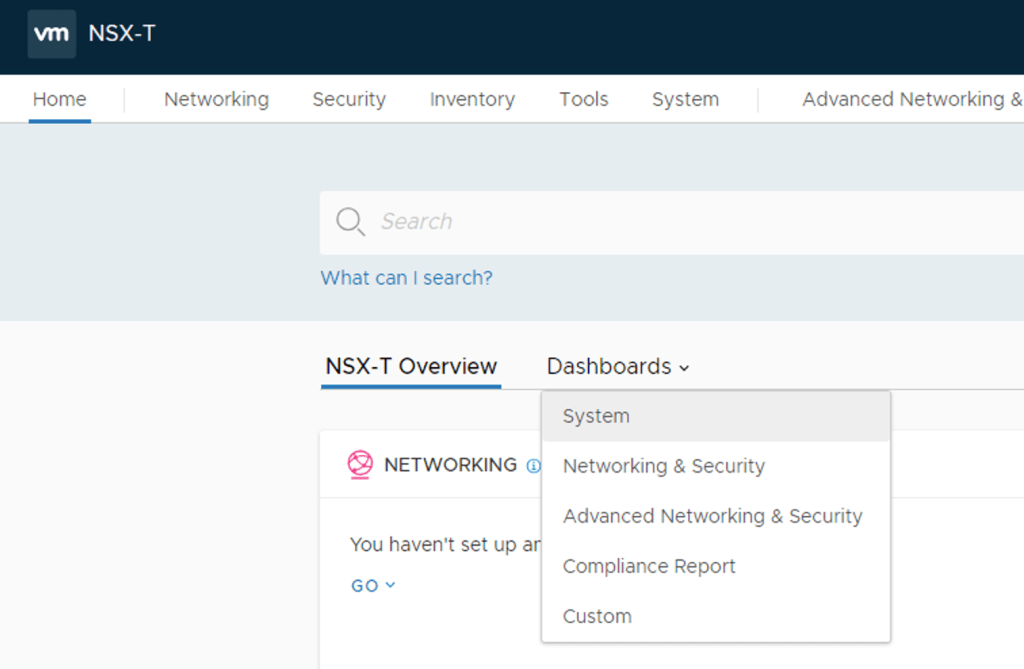
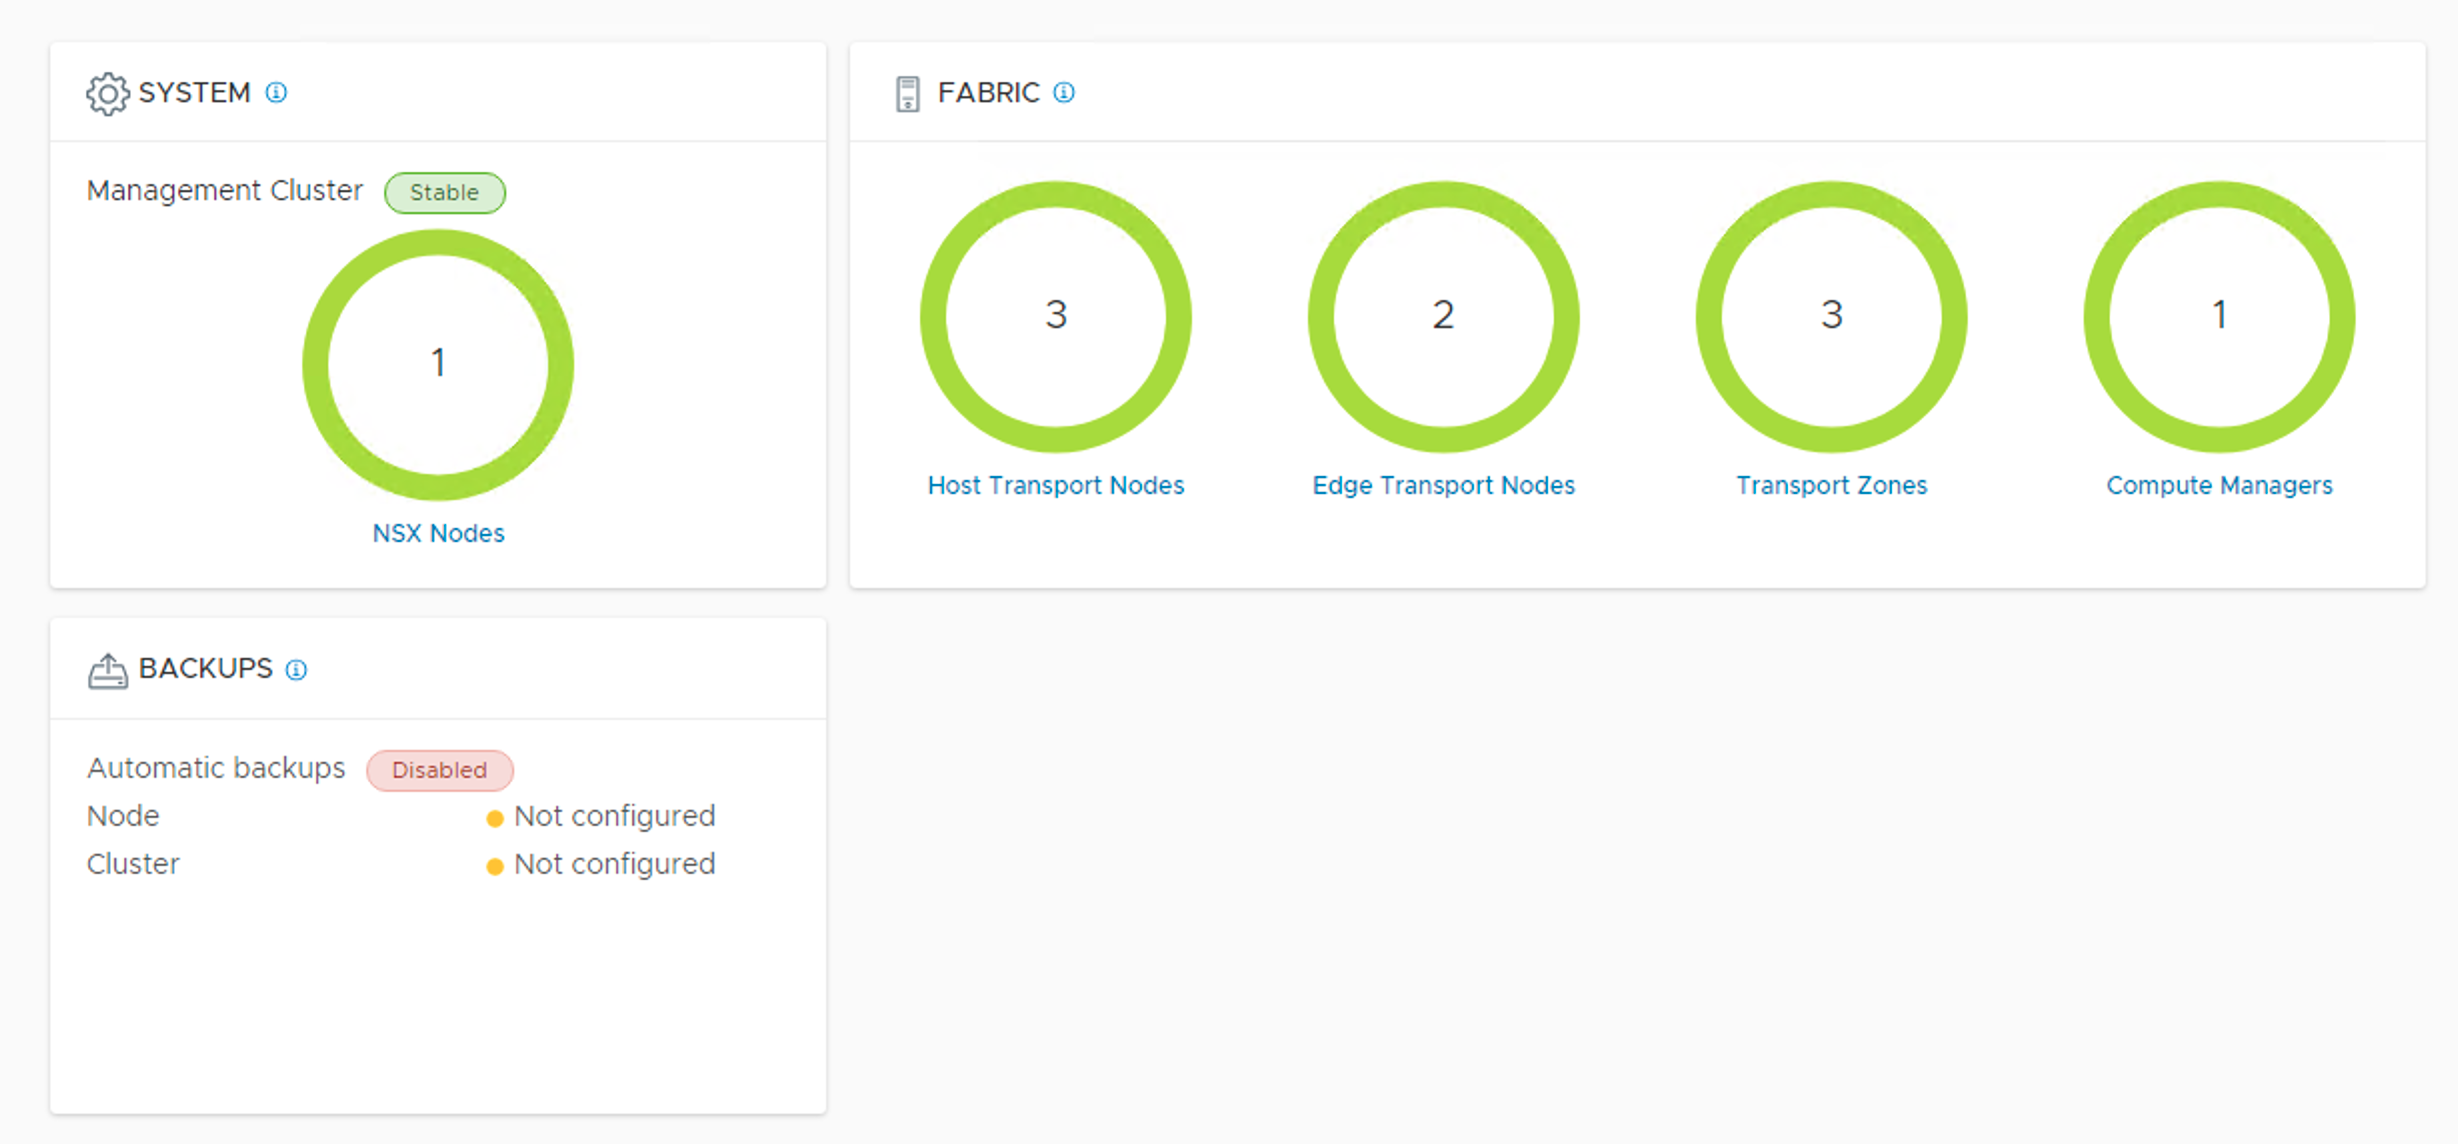
Another pretty important thing is verifying that the components are up and running. For this I’ll check the new dashboard under Home > Dashboards > System:
Green circles usually mean things are good (I should set up automatic backup though).
New user interface
The user interface got a pretty big overhaul in version 2.4 and it takes some time before you find your way around.
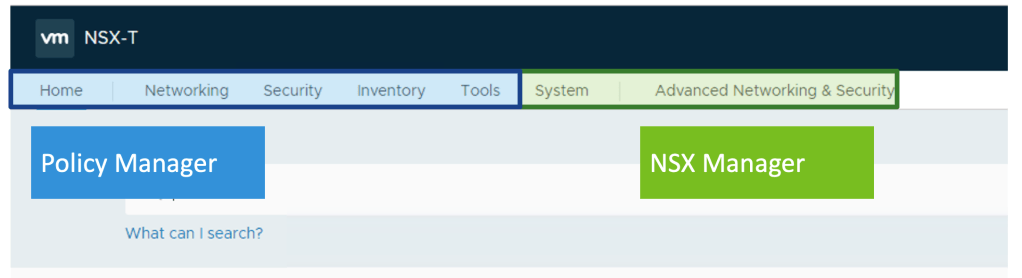
Different parts of the UI are handled by different underlying managers:
As you can see the UI is basically divided in two parts where one part is handled by Policy Manager and the other part by NSX Manager.
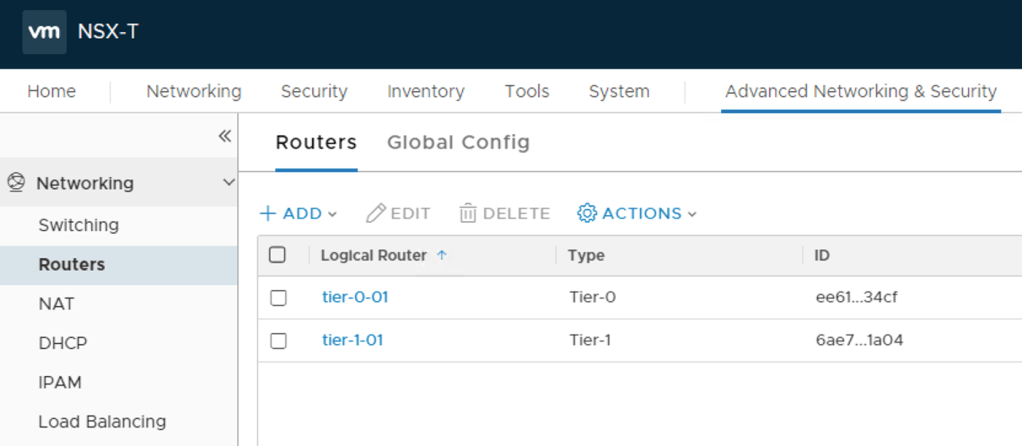
This has some immediate practical consequences. In version 2.3 my logical switches and logical routers were created by NSX Manager. For that reason they are found under “Advanced Networking & Security”:
Moving forward the Policy Manager/Simplified UI should be used (as much as possible) to create and manage NSX-T objects.
Simplified UI
So let’s have a very brief look at the Simplified UI.
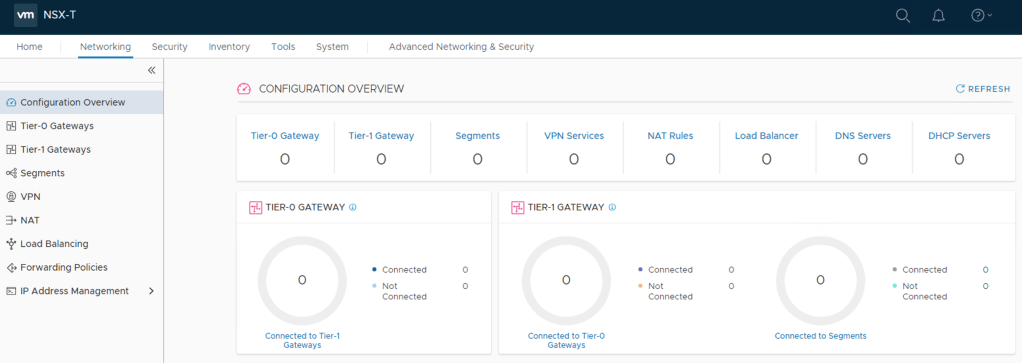
Under “Networking” I see some new NSX-T terminology:
Logical switches are called “Segments” and logical routers are now called “Gateways”. Nothing too shocking, but good to know.
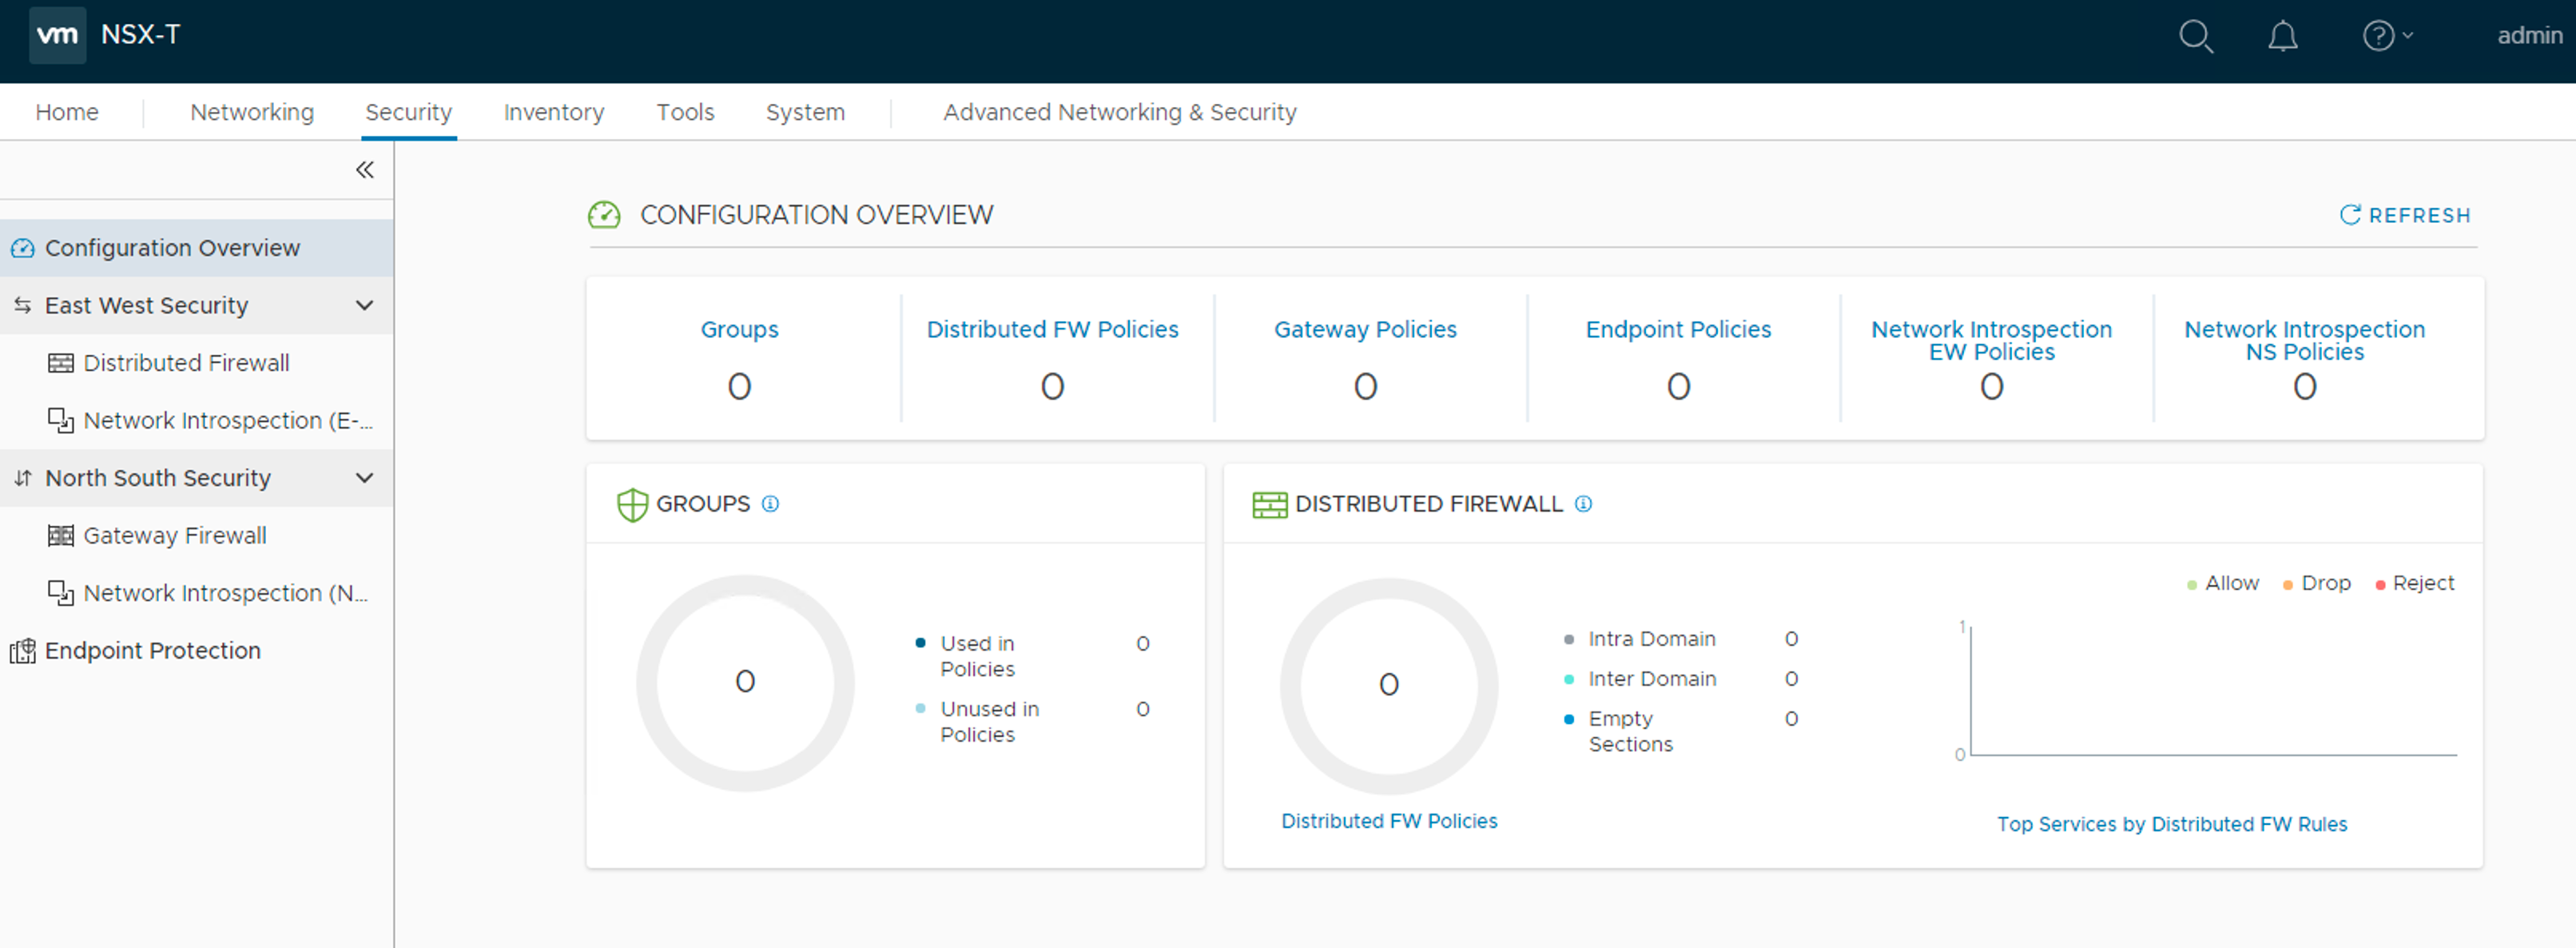
A look under “Security” shows that things are categorized in “East West Security” and “North South Security” which makes sense:
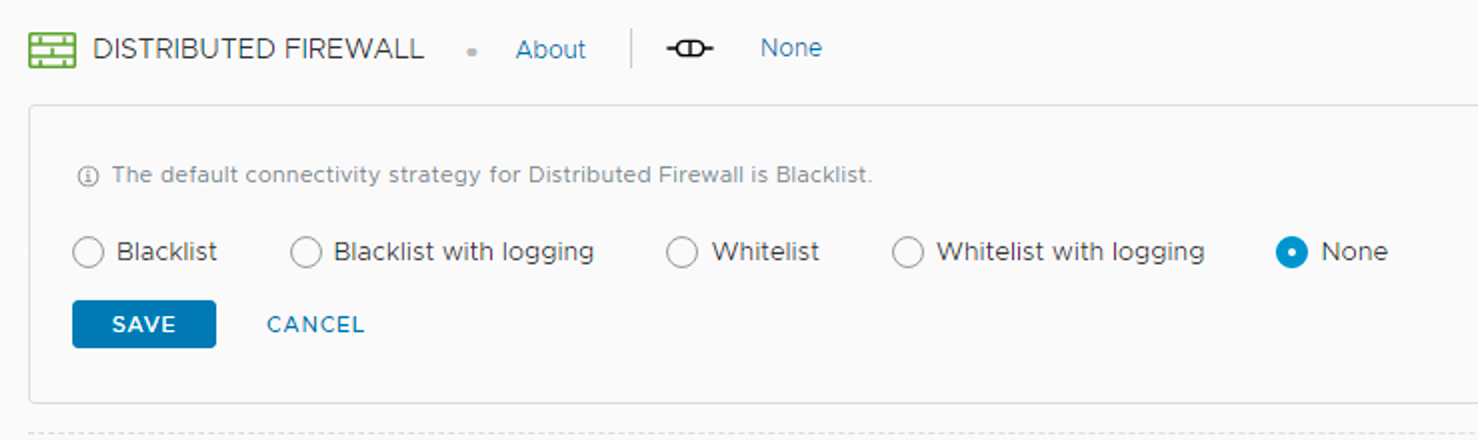
Have a closer look at the distributed firewall shows some new stuff as well.
First of all we can now choose a default connectivity strategy:
It’s set to “none” as I upgraded from version 2.3. For new deployments the default is “Blacklist” (AnyAllow as the catchall rule).
Next we see that there are now predefined categories that we can use when building a security policy model for the East-West firewall:
Conclusion
Upgrading my lab environment from version 2.3 to version 2.4 was a painless process. Good documentation and the upgrade coordinator made it a fairly straight forward process.
The NSX-T 2.4 upgrade is bigger than the minor version adjustment implies. We have some architectural changes, an almost completely new UI and some new terminology. There are many other things as well that I haven’t touched upon in this post, but will explore in more detail in upcoming posts.
All in all I would definitely say that version 2.4 is a landmark release in the history of NSX-T. With this release NSX-T also reaches feature parity with NSX-v and that should make it the SDN platform of choice moving forward.
Welcome to the final part of this series. We’ve come a long way. After configuring North-South dynamic routing between the Tier-0 logical router and the “physical” (pfSense) router in part 5, it’s now time to add a Tier-1 logical router and some logical switches.
Tier-1 logical router
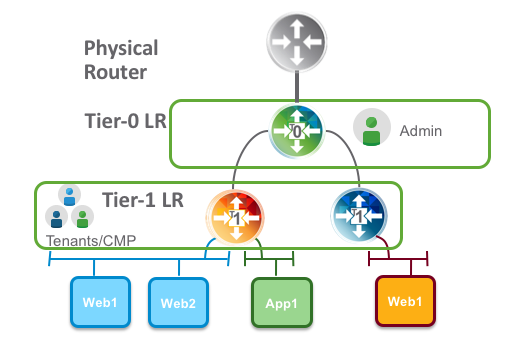
The purpose of Tier-1 routers is to facilitate for true multi-tenancy in the NSX platform. Tenants have their own T1 routers that connect to an administrator’s T0 router. Changes in the physical network do not necessarily affect tenants Tier-1 routers.
Multi-tenancy with T1 routers
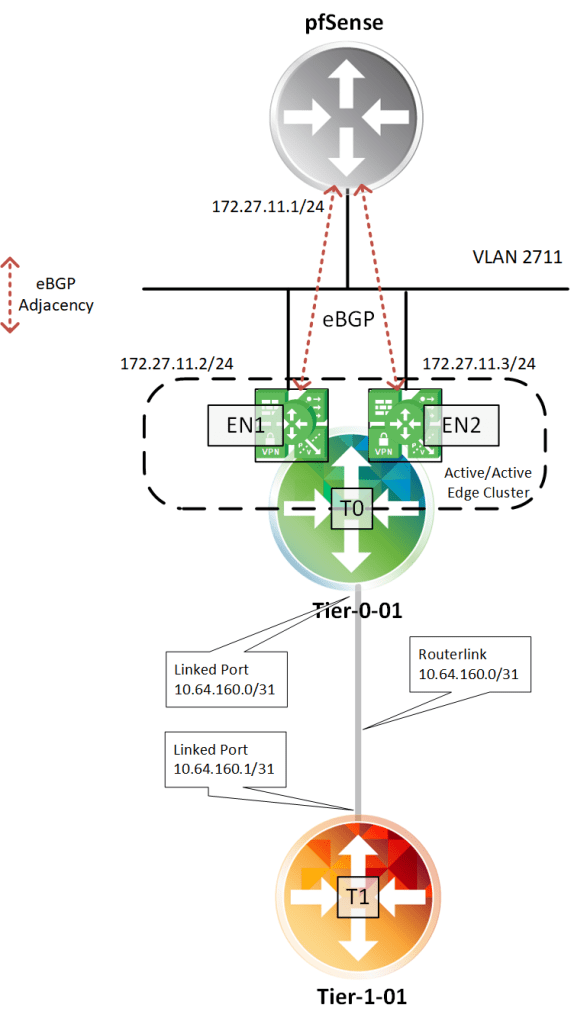
A Tier-1 logical router needs to be connected to a Tier-0 logical router to get the northbound physical router access. The connection between T1 and T0 is established over a special routerlink. This link is assigned a /31 subnet within the 100.64.0.0/10 reserved address space (RFC6598).
Deploying the Tier-1 logical router
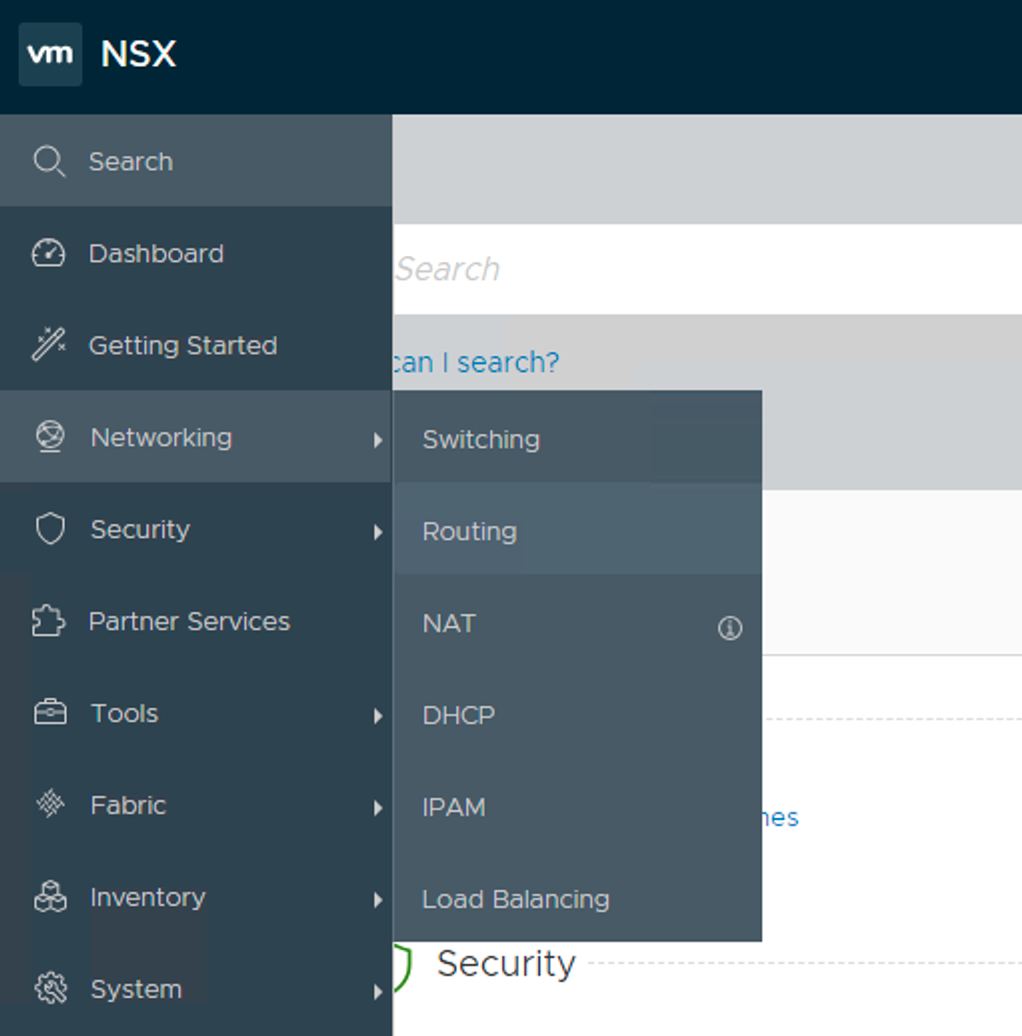
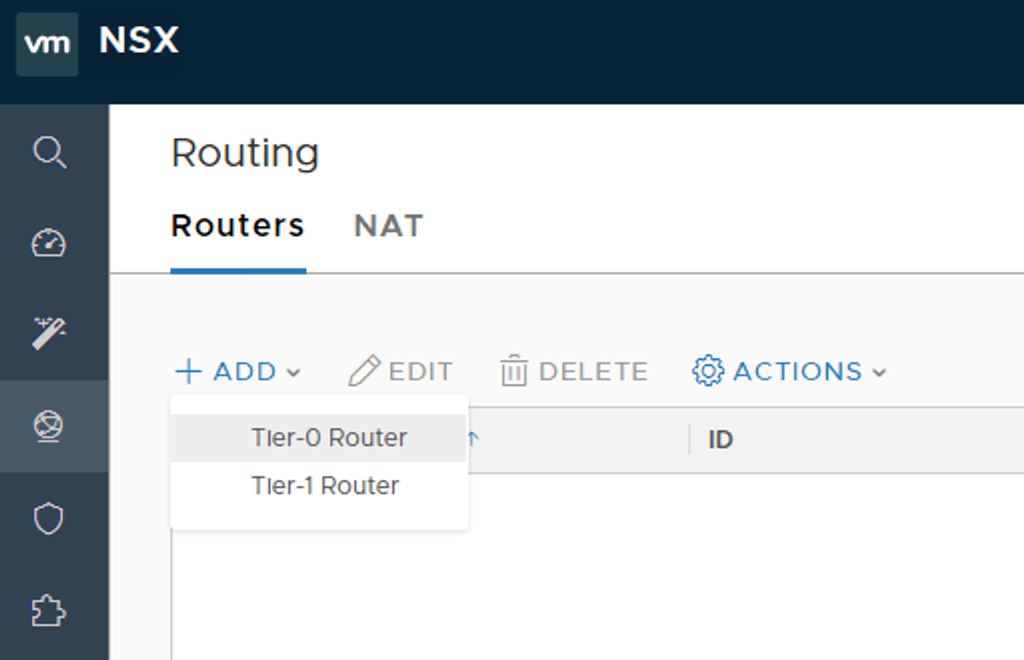
In NSX Manager I navigate to Networking > Routing. Click on the “+ Add” button and choose “Tier-1 Router”:
A couple of things need to be specified here. I’m calling my T1 “tier-1-01” and pick the “tier-0-01” Tier-0 router I created in part 5. I also need to pick an Edge cluster, Failover Mode, Edge cluster members (Edge transport nodes), and a preferred member.
Clicking “Add” deploys the Tier-1 router.
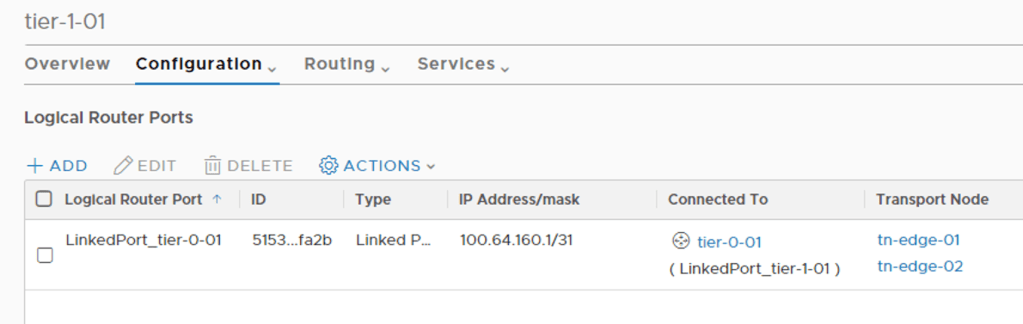
When clicking on the new Tier-1 router and having a look under Configuration > Router Ports I can see the special router port used for the routerlink to the Tier-0 router:
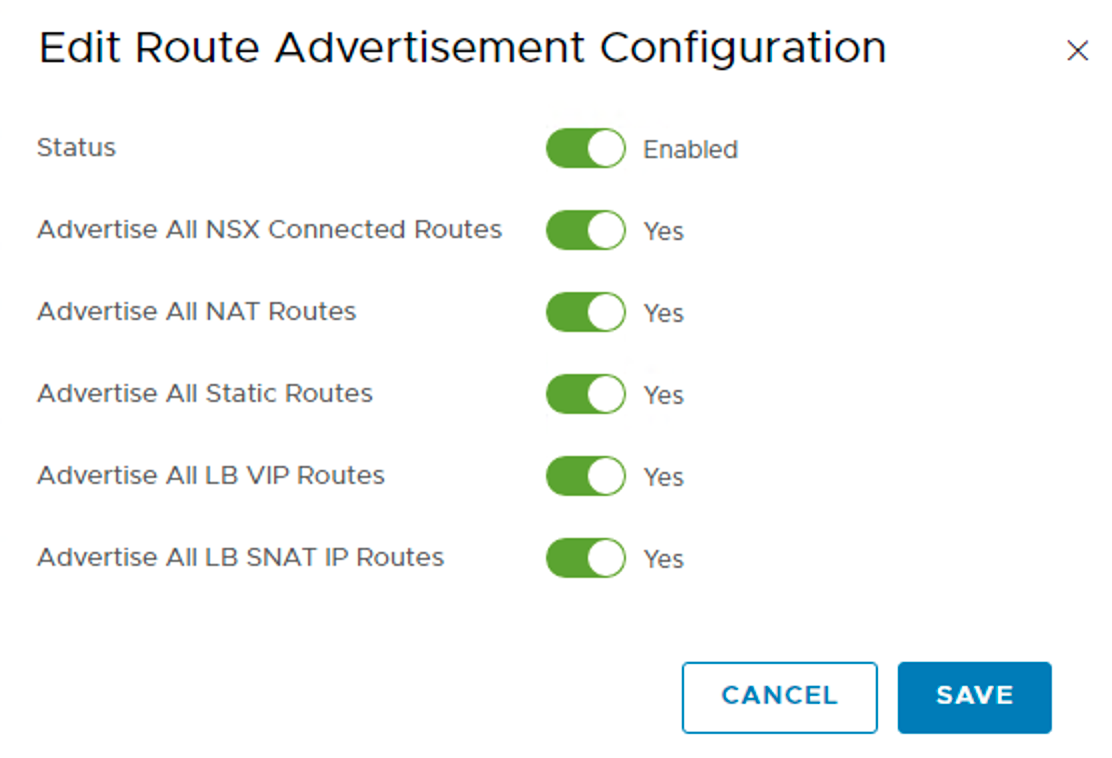
Logical networks created in NSX should be advertised to the Tier-0 and ultimately the physical router. For this to happen I need to configure Routing > Route Advertisement:
Here I choose to advertise everything that is available.
And that’s it for the basic configuration of my Tier-1 router. The logical router topology looks like this at this point:
Creating Tier-1 downlink ports
Downlink ports are Tier-1 router ports connecting to logical switches. They serve as a default gateways for the virtual machines that are in the same subnet.
I will create three downlink ports for now. I will deploy the classic three tiered network segments: web, app, and db.
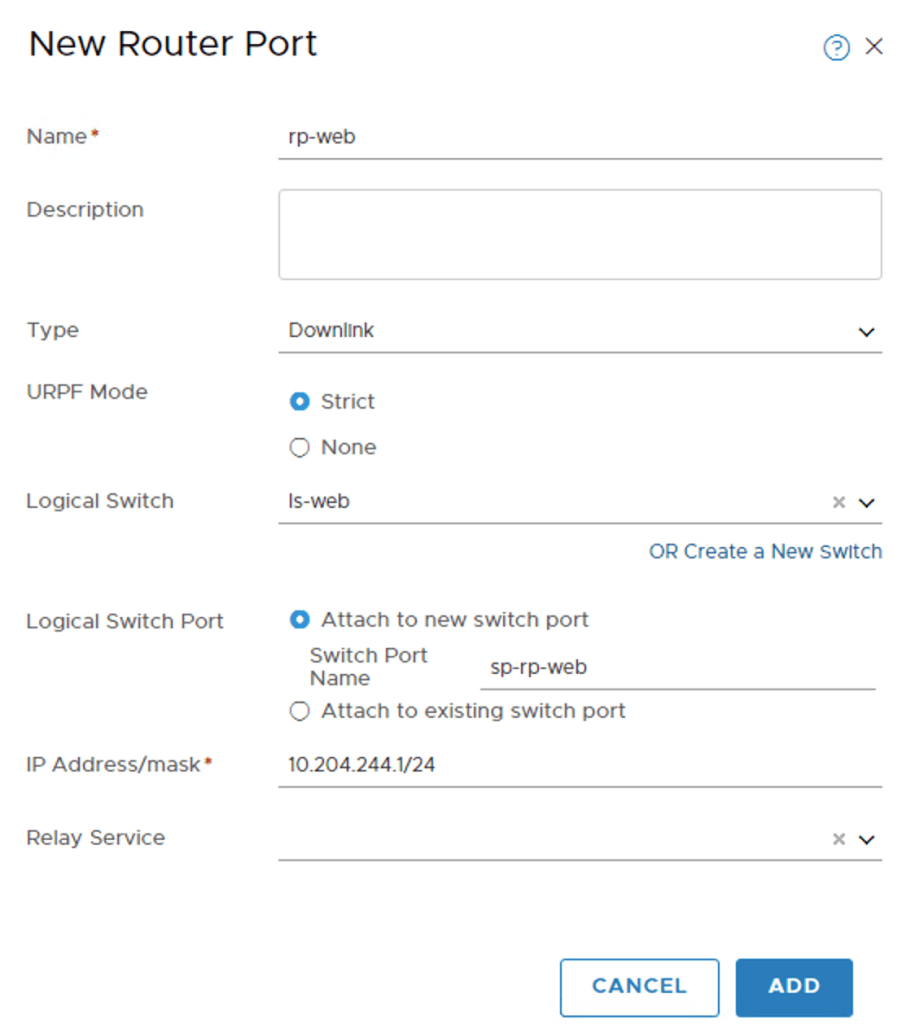
On the Tier-1 router I once again navigate to Configuration > Router Ports. Adding the first router port called “rp-web”:
As you see I configured IP address 10.204.244.1/24 for this interface. It’s basically here I decide that the web IP subnet is 10.204.244.0/24.
You may have noticed that I also created a new logical switch called “ls-web” in the process. Its configured like this:
The logical is switch is part of the “overlay01” transport zone. No surprise here.
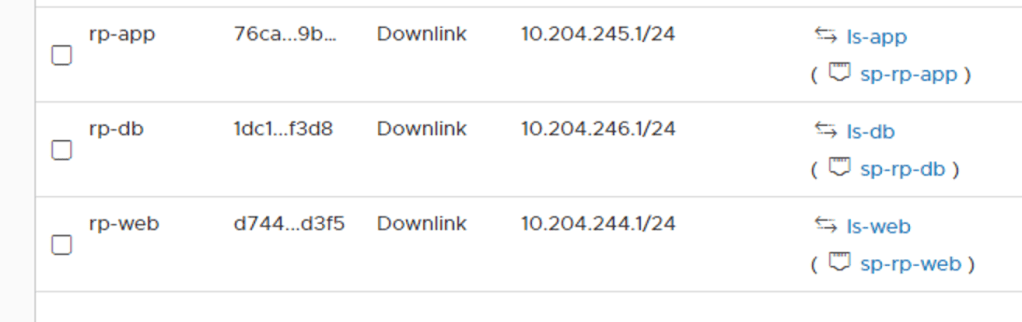
I repeat these steps to create the “rp-app”, and “rp-db” router ports and their associated logical switches
Downlink router portsLogical switches
The topology with the logical switches attached to the Tier-1 router:
Looking on the Tier-1 router under Routing > Route Advertisement I can see that my three subnets are being advertised:
Verifying routing
Let’s see if the distributed router on the Tier-0 has these networks in its forwarding table. I log in to one of the Edge VMs CLI and change to the Tier-0 DR context:
get logical-router
Listing the logical routers
The Tier-0 DR is living in VRF 6.
vrf 6
get forwarding
There are, among others, the three IP subnets associated with my newly created router ports. I see that the routerlink subnet 10.64.160.0/31 is used to get to the logical networks which seems to make sense.
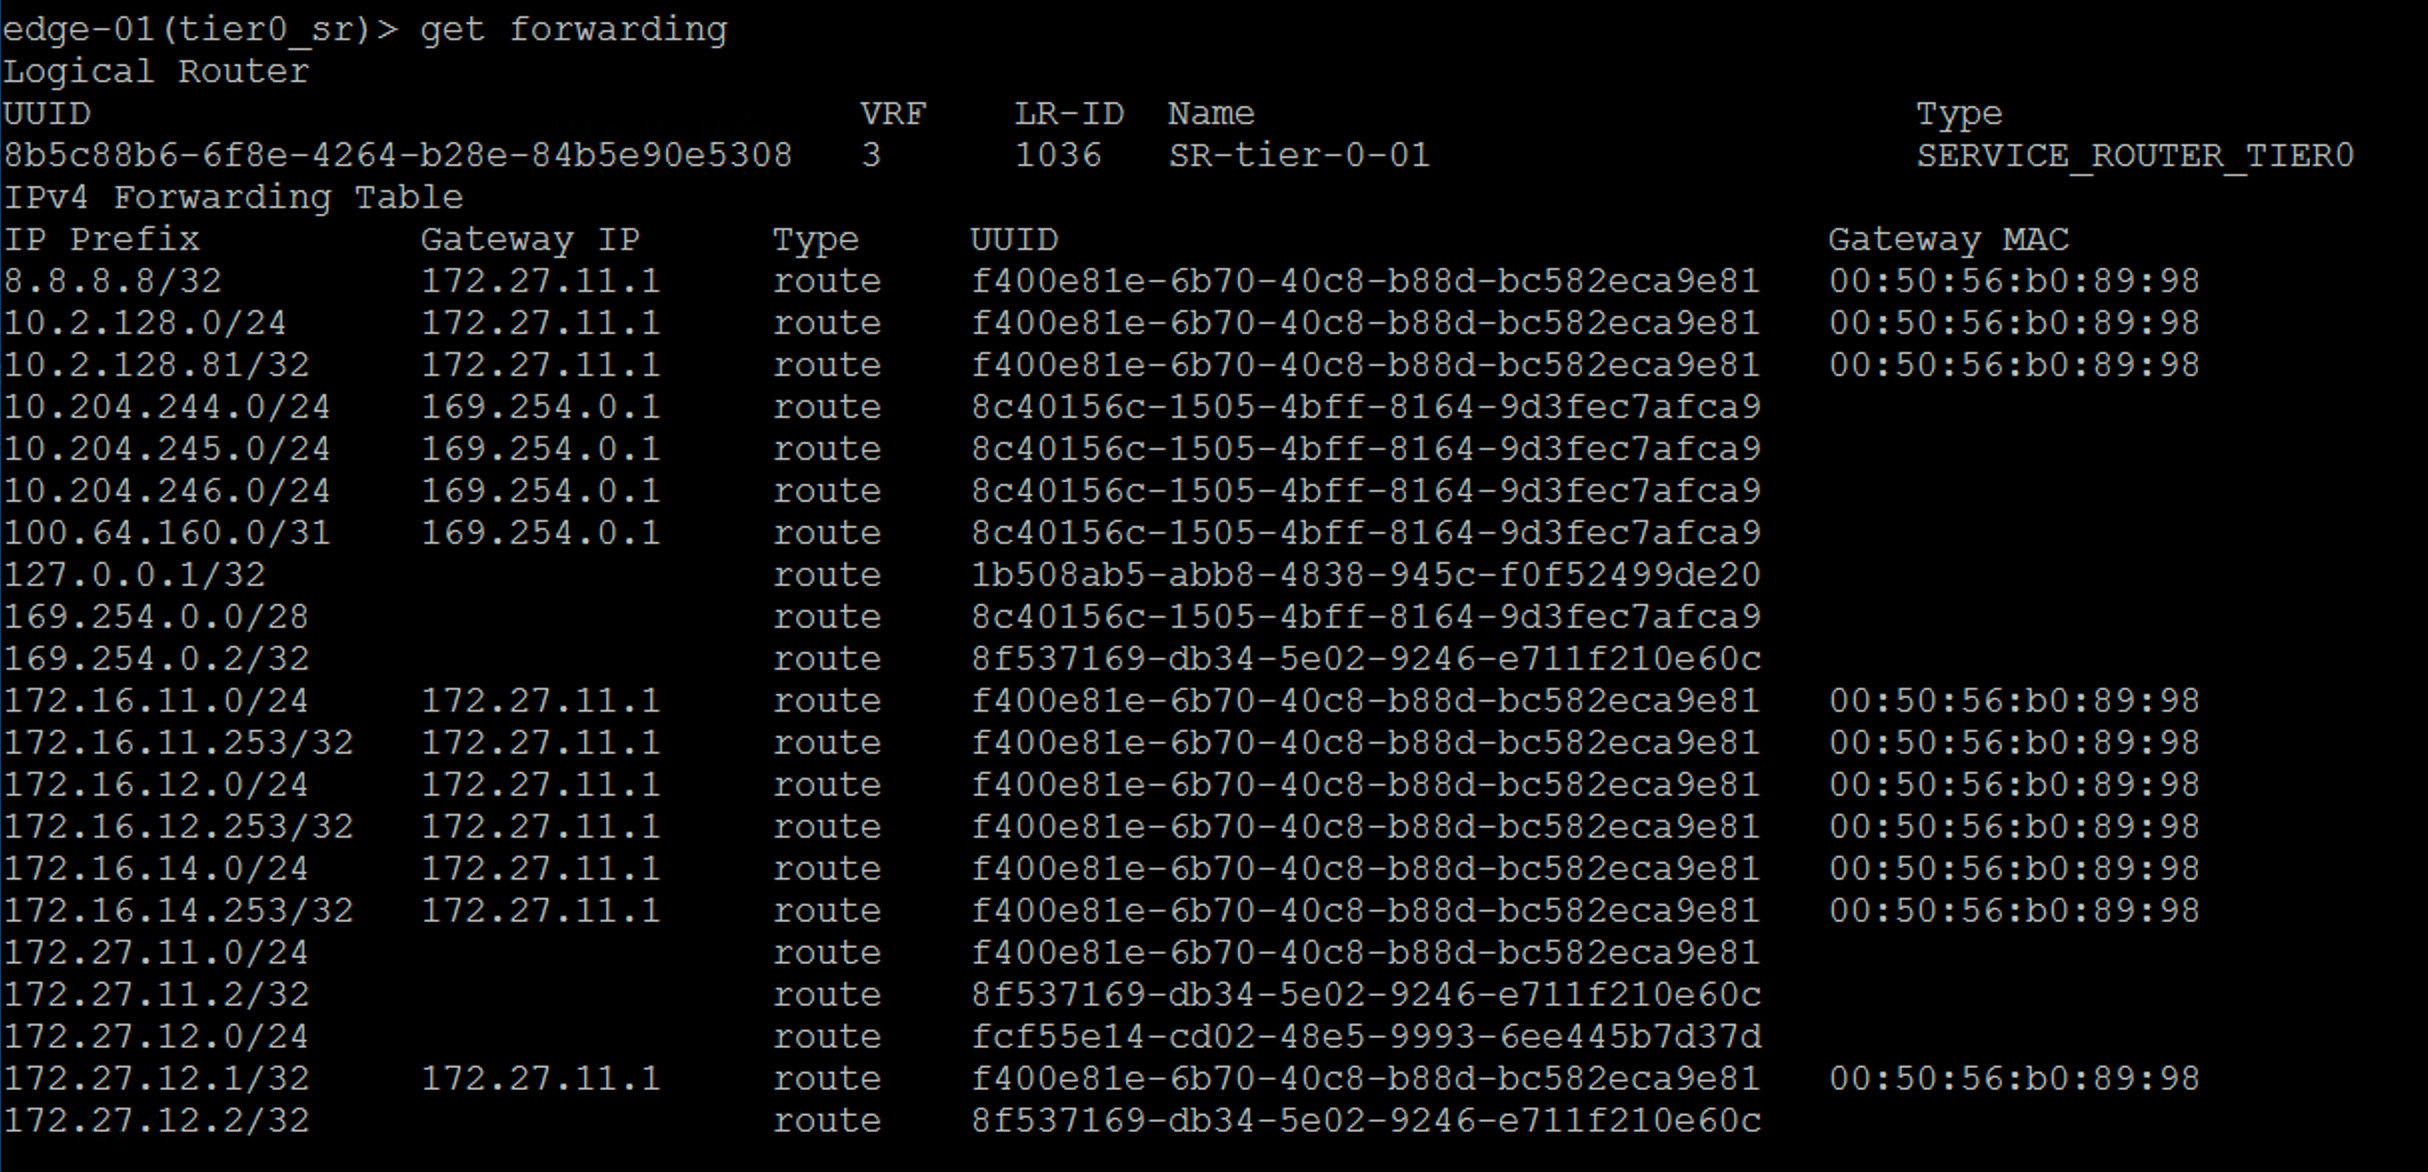
Let’s also having a look at the Tier-0 SR context
vrf 3
get forwarding
Beautiful! My new networks ended up all the way there too. As you can see the Tier-0 SR uses the intra tier transit link as the gateway to get to these networks. This is also as expected.
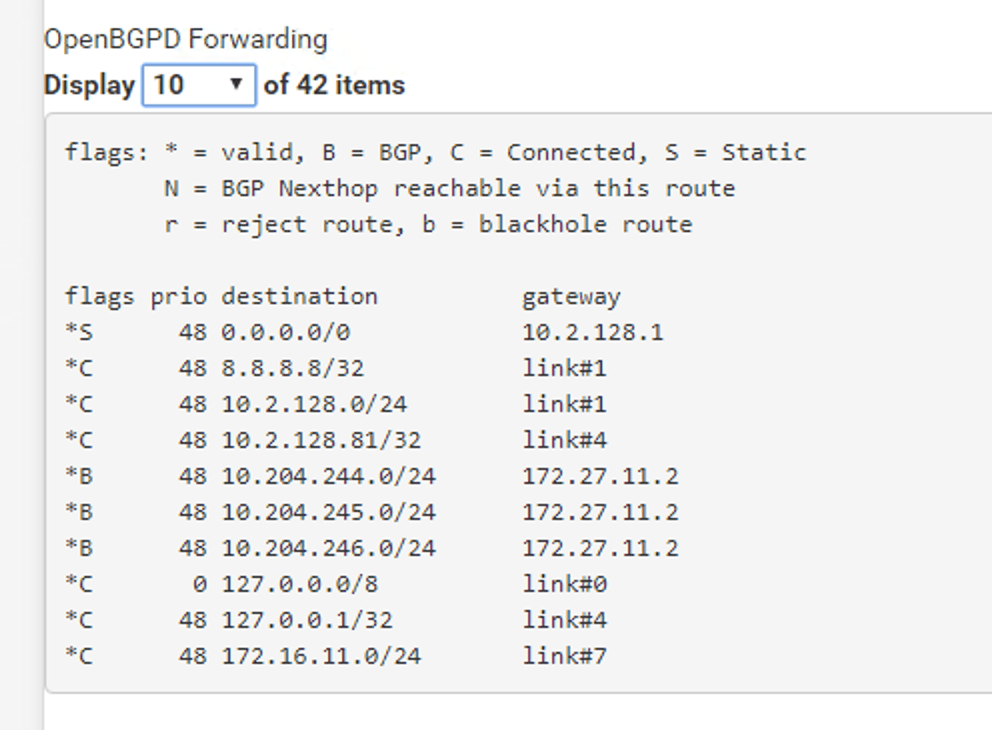
The million dollar question is: Are my new logical networks known on the physical network? Let’s check the forwarding table at my pfSense:
Absolutely. I’m seeing my three IP subnets in pfSense’s forwarding table. I can even ping the Tier-1 “rp-web” router port from the pfSense:
So this is where the NSX admin takes a step back and the VI admin comes in and starts deploying VMs on the new logical networks. 😉
Connecting a virtual machine
Speaking of which, how do I connect a VM to an NSX-T port group? It turns out to be really easy. NSX-T logical networks show up as N-VDS port groups in vCenter:
And therefore connecting a VM to an NSX-T logical network is done the usual way:
Conclusion
That’s it! This was a very basic NSX-T deployment in 6 parts. I hope you enjoyed it. There is much more to look at and configure in NSX-T, but the main platform is in place.
From here it will be about enabling features and possibly scaling out a bit. I expect to return to this lab environment in coming blog posts.
One thing that happened while I was writing the series was the NSX-T 2.4 release. There are a bunch of new features and improvements in version 2.4 and my next blog post might very well be about upgrading this environment to 2.4. Stay tuned!
Things are working out pretty well so far so I’ll simply stick to this plan and go on with setting up NSX routing.
Tier-0 logical router
The Tier-0 logical router acts as a gateway service between the logical and physical network. A Tier-0 logical router has downlink ports to Tier-1 logical routers and uplink ports that connect to the external network. Tier-0 logical routers support things like BGP dynamic routing and ECMP.
Deploying the Tier-0 logical router
No reason to wait. In NSX Manager I navigate to Networking > Routing:
Here I’m clicking on the “+Add” button and choose “Tier-0 Router”:
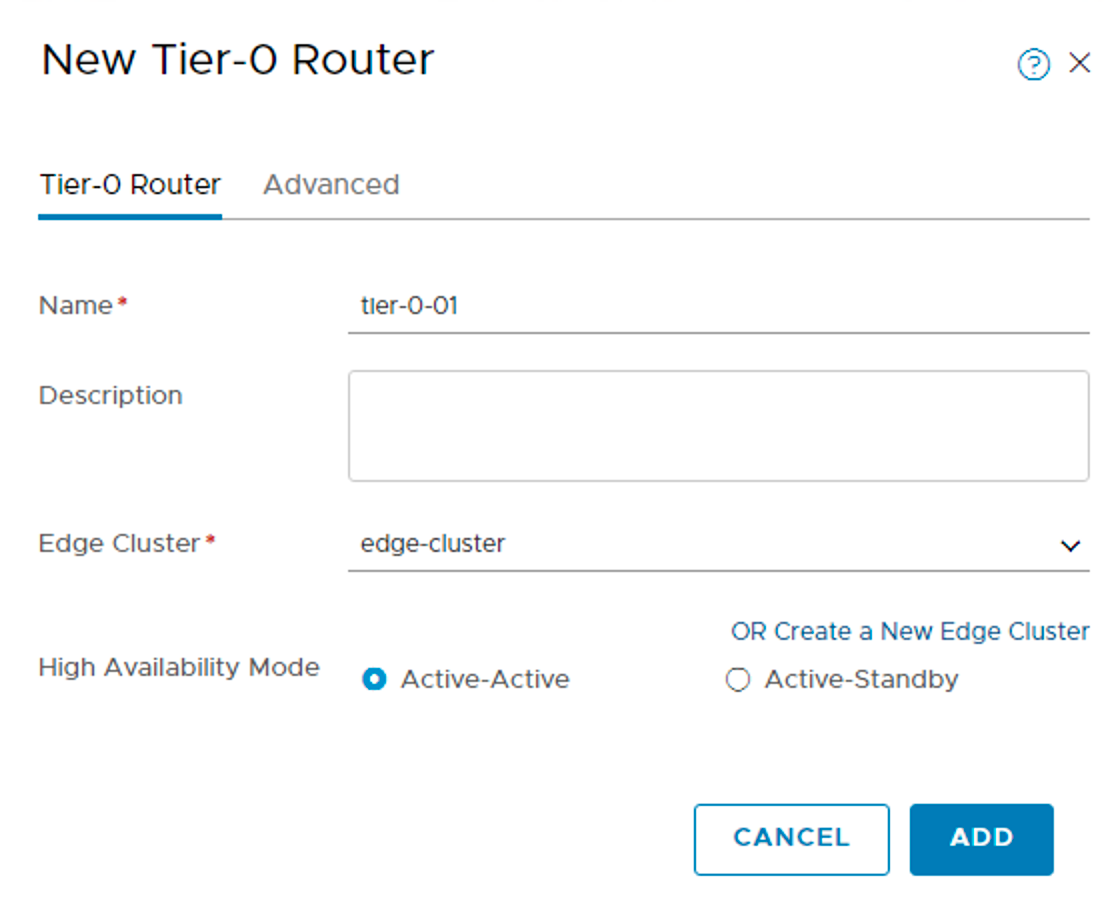
I’m calling the Tier-0 router “tier-0-01” and select the Edge cluster I created in part four. I’m leaving the high-availability mode at the default “Active-Active” meaning that traffic is load balanced across all members of the Edge cluster.
Creating Tier-0 router ports
With the Tier-0 router deployed I will now create four router ports (of which two will be used at this point). I click the “tier-0-01” logical router and navigate to Configuration > Router Ports:
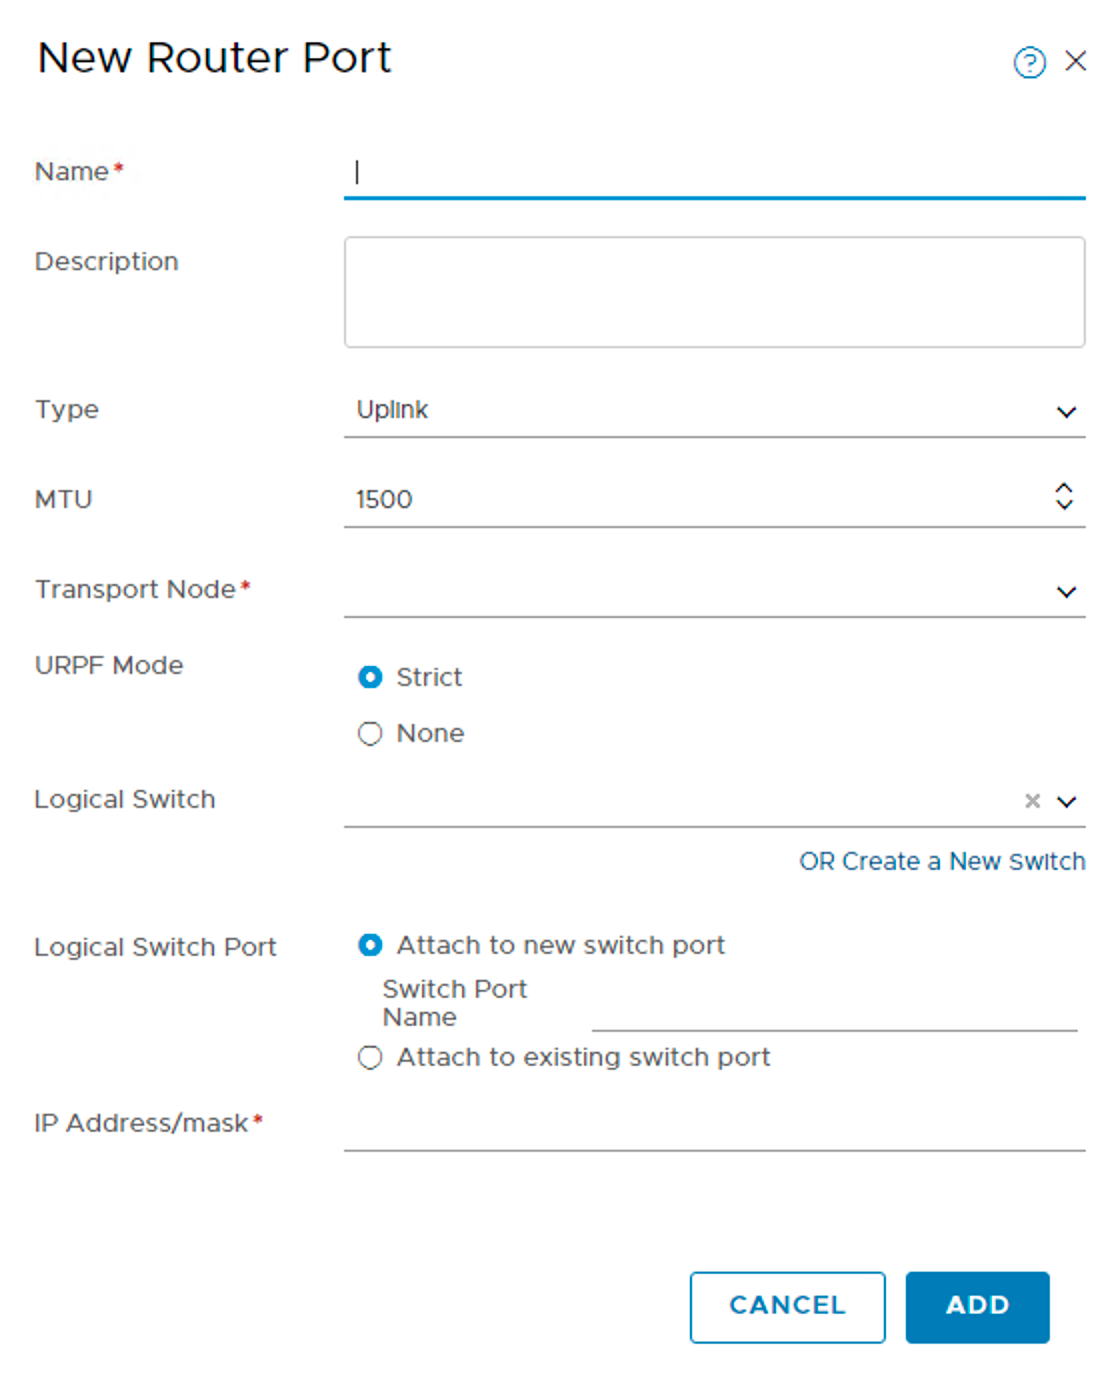
Clicking the “+Add” button brings up the following form:
I will use these are settings for the four router ports in my lab:
Setting
Router Port #1
Router Port #2
Router Port #3
Router Port #4
Name
rp-uplink01-tn-edge-01
rp-uplink02-tn-edge-01
rp-uplink01-tn-edge-02
rp-uplink02-tn-edge-02
Type
Uplink
Uplink
Uplink
Uplink
MTU
1500
1500
1500
1500
Transport Node
tn-edge-01
tn-edge-01
tn-edge-02
tn-edge-02
URPF Mode
Strict
Strict
Strict
Strict
Logical Switch
ls-uplink01
ls-uplink02
ls-uplink01
ls-uplink02
Logical Switch Port Name
sp-uplink01-tn-edge-01
sp-uplink02-tn-edge-01
sp-uplink01-tn-edge-02
sp-uplink02-tn-edge-02
IP Address/mask
172.27.11.2/24
172.27.12.2/24
172.27.11.3/24
172.27.12.3/24
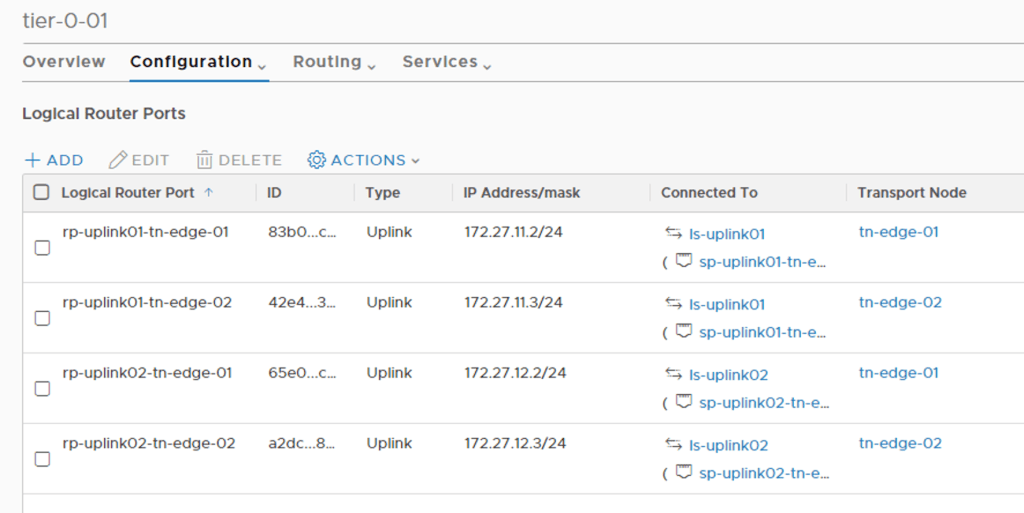
The four router ports once they are created:
As you can see each Edge transport node has two uplink router ports.
Configuring Tier-0 dynamic routing
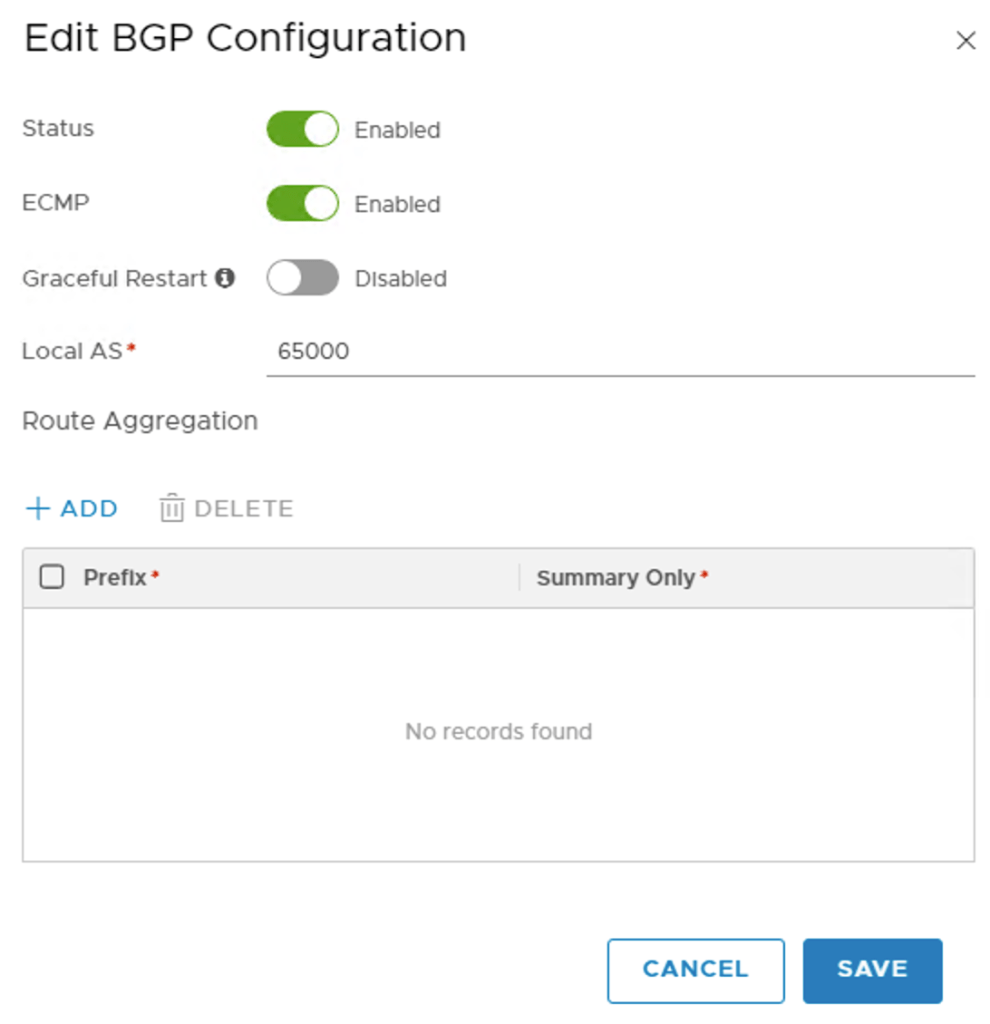
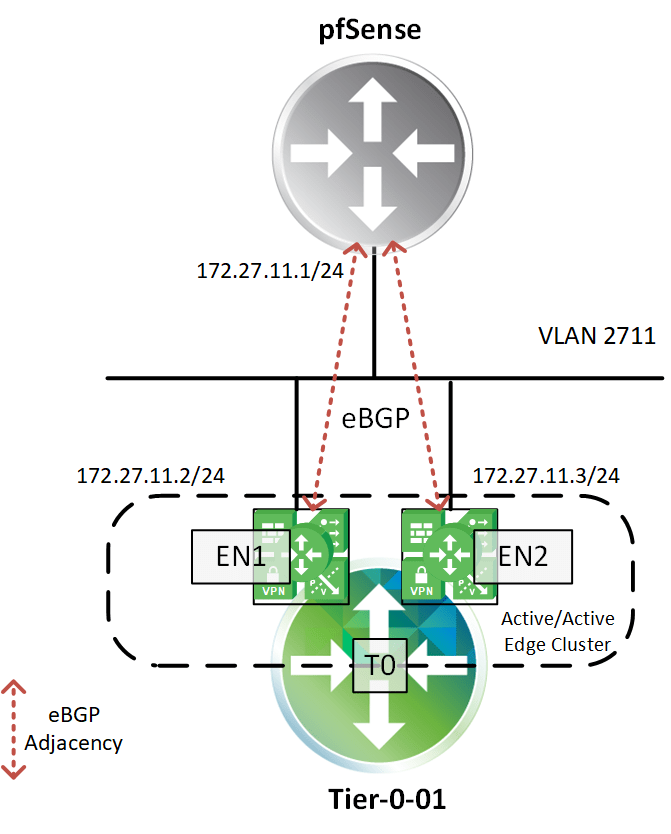
In my lab I will use BGP dynamic routing between Tier-0 and pfSense. On the Tier-0 router navigate to Routing > BGP:
First I enable BGP and ECMP and set the local AS to 65000:
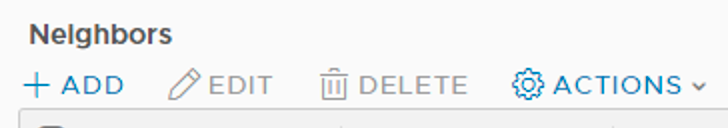
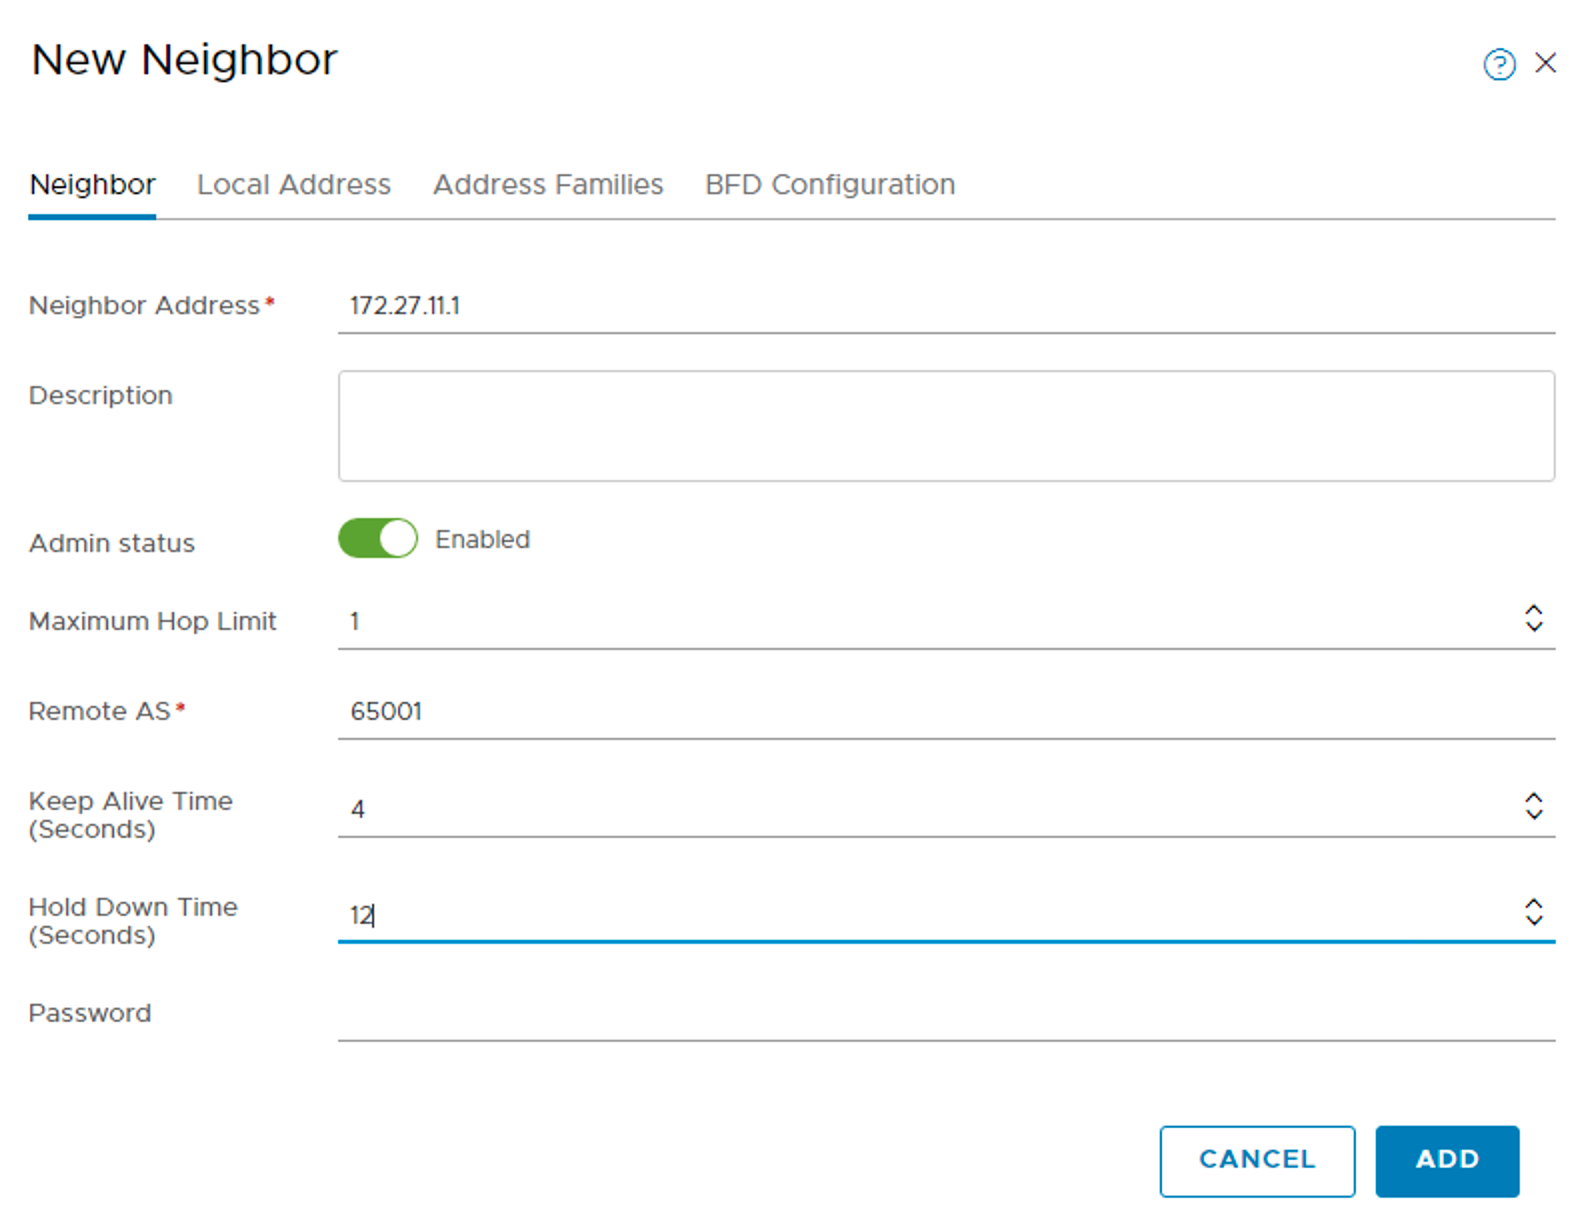
Next I’m going to add the BGP neighbor by clicking the”+Add” button under “Neighbors”:
The neighbor address is 172.27.11.1 and the remote AS is 65001 as configured on the pfSense. I also modify the values for “keep alive” and “hold down” to 4 and 12 seconds respectively.
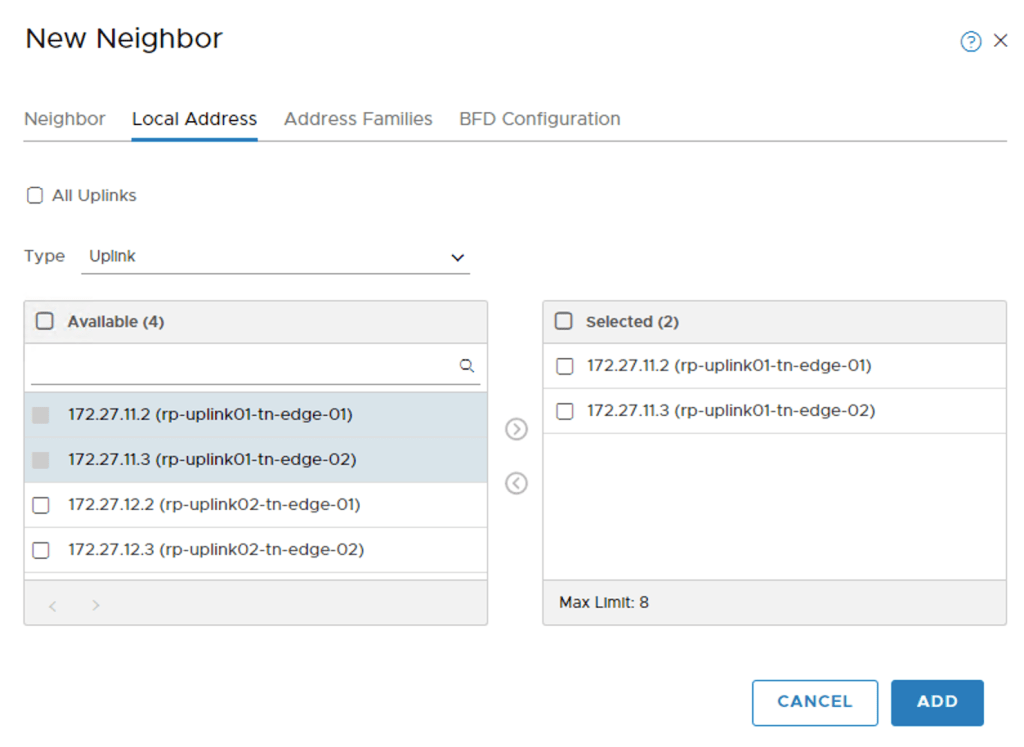
Under “Local Address” I will only select the two router ports in VLAN 2711 for now:
Note that the IP addresses of the Tier-0 uplink router ports have already been added as BGP neighbors in the pfSense configuration.
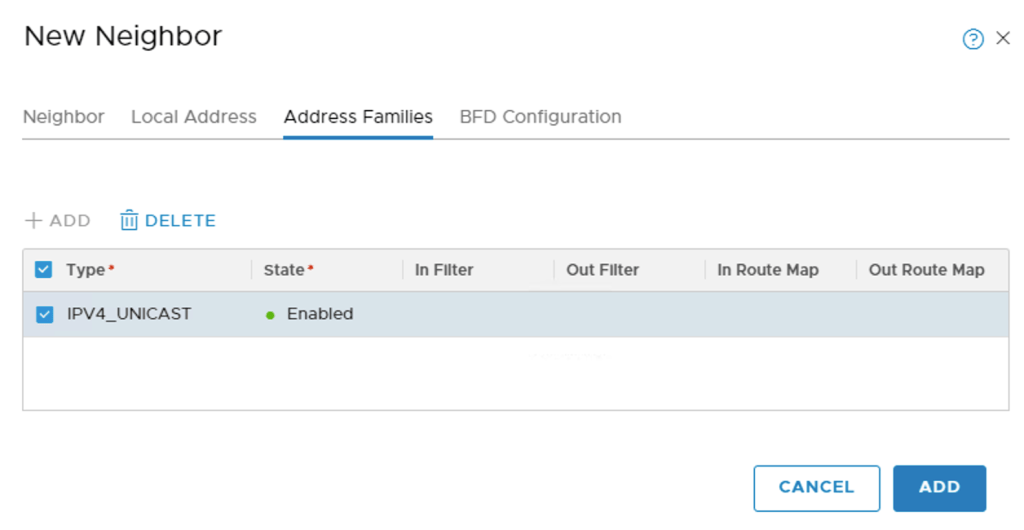
Finally, under “Address Families” I add and enable “IPV4_UNICAST”:
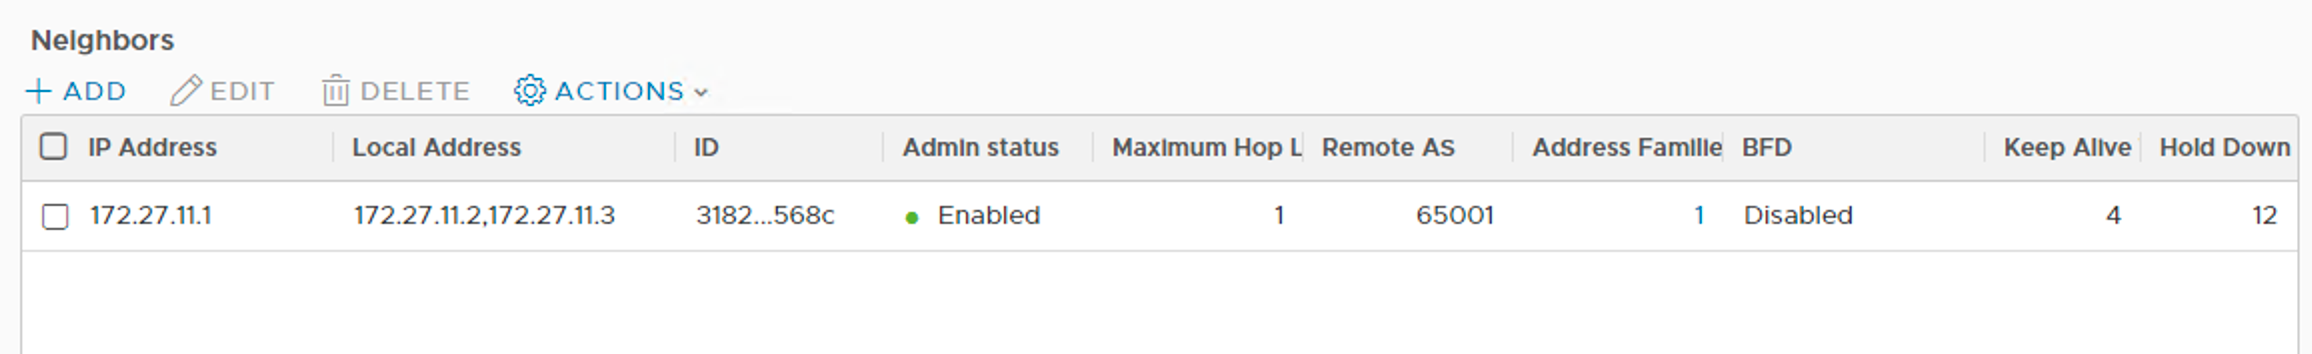
The BGP neighbor has now been configured:
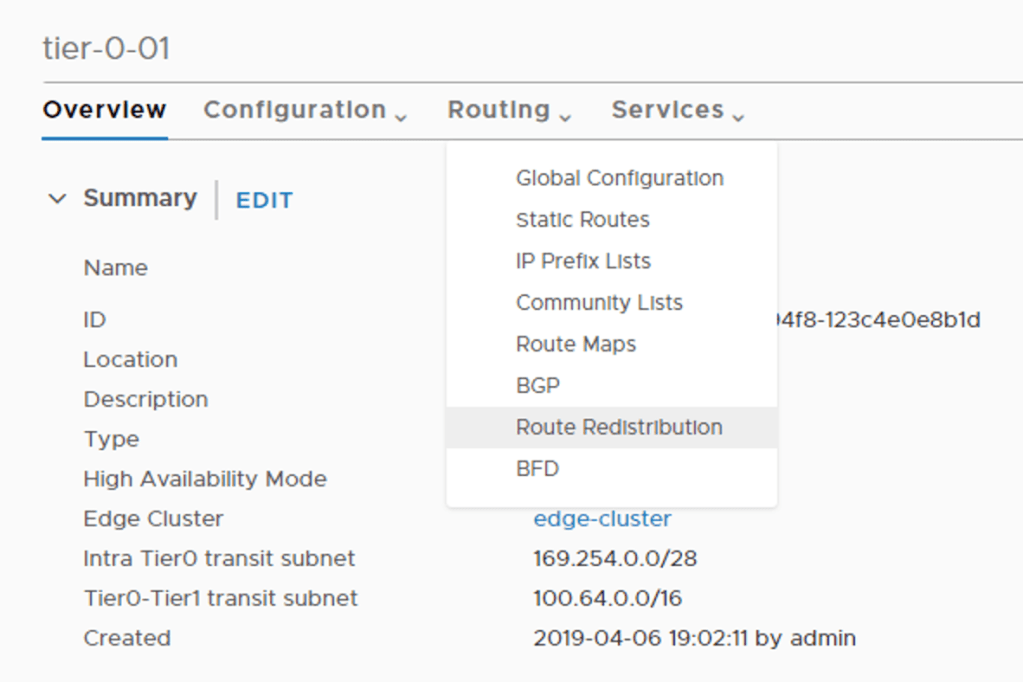
The last thing I want to enable on the Tier-0 router is route redistribution. I click on Routing > Route Redistribution:
I create a new criteria called “redist-all” and select all sources:
This ensures that the Tier-0 will redistribute routes from all available sources.
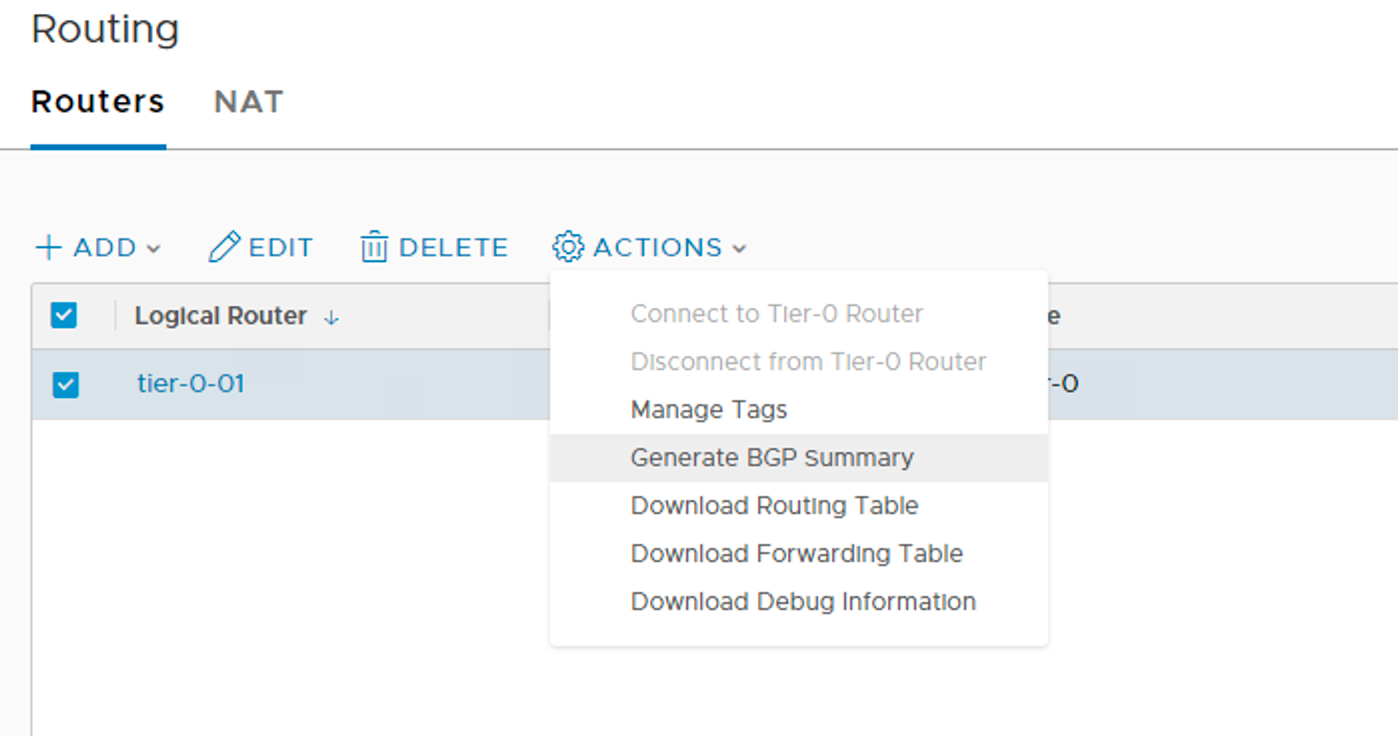
Verifying Tier-0 dynamic routing
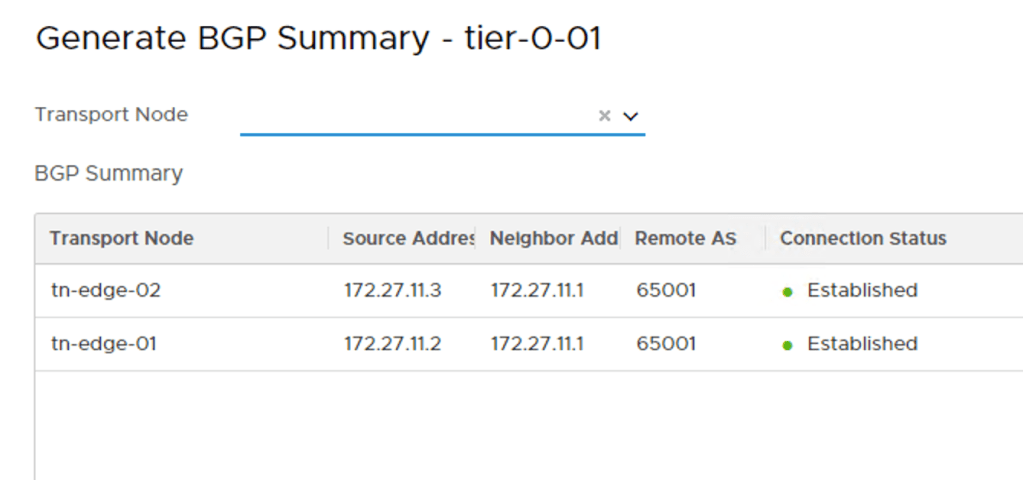
Let’s start by checking if the BGP neighbor connection status looks healthy. I select the “tier-0-01” router and click on Actions > Generate BGP Summary:
This generates a list with the current neighbor connection status:
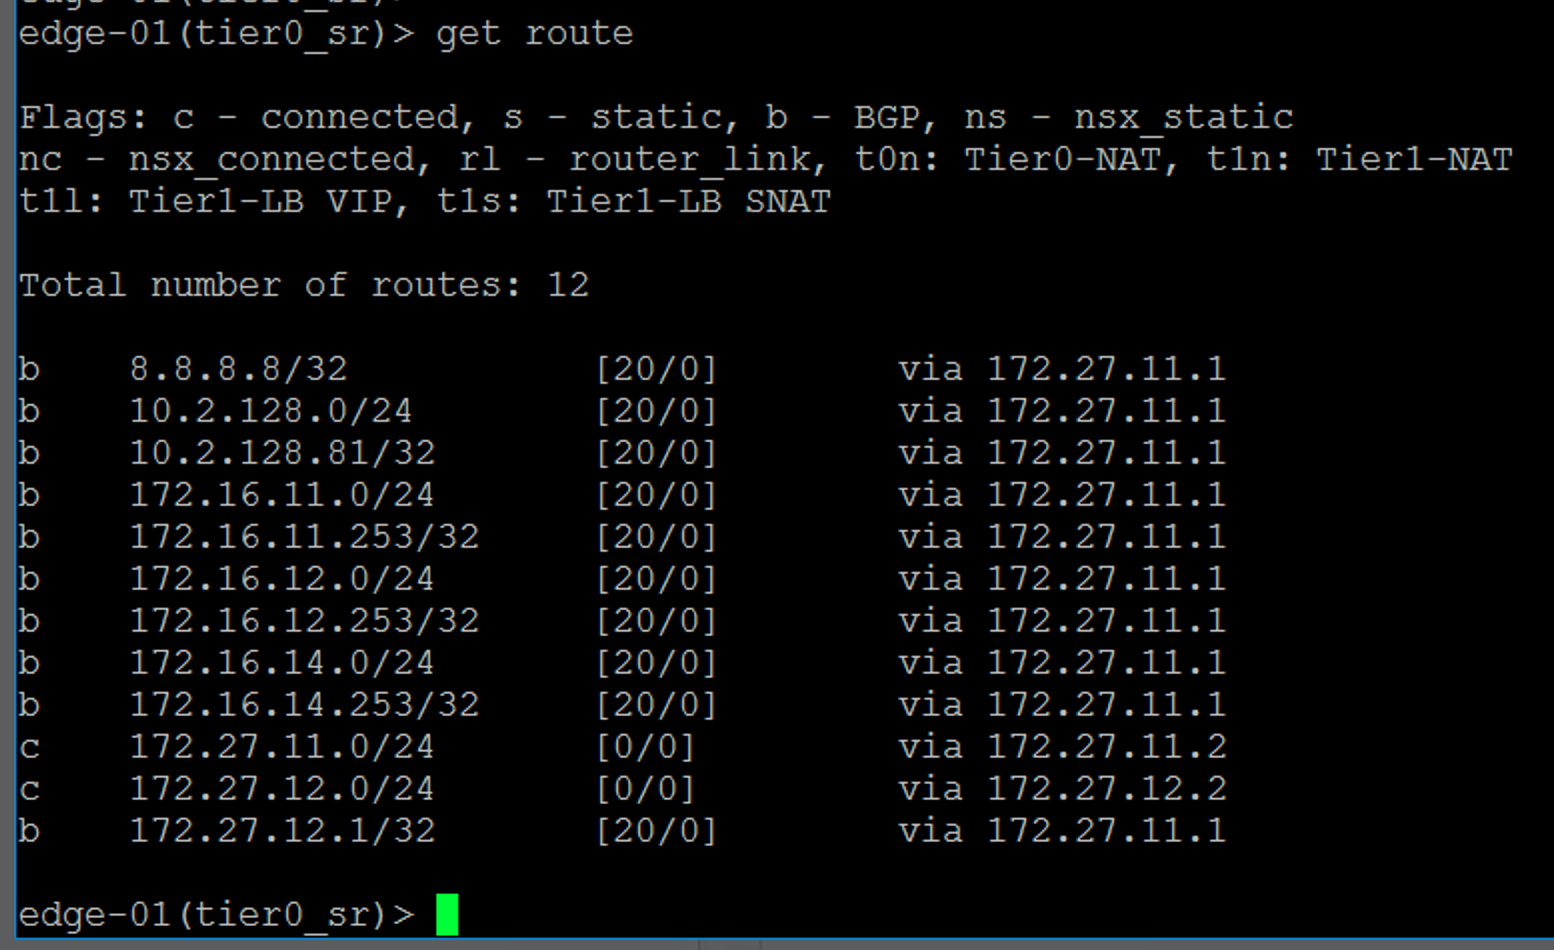
To verify that routes are received from the pfSense router, I log in to one of the Edge VMs and run the following commands:
get logical-routers
Listing the logical router instances on the Edge VM. It’s VRF 3 (service router) I’m interested in. Changing to VRF 3’s context:
vrf 3
And now I run:
get route
This command lists the routes in the VRF 3 context. I can see a number of routes coming from the pfSense router via BGP (b).
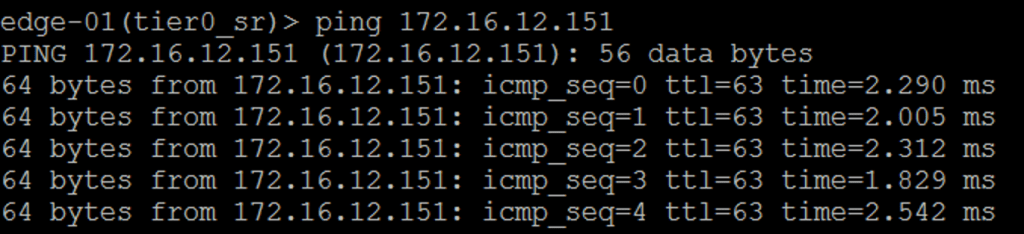
To test actual traffic flow I ping an IP addresses located in the physical network from within the VRF 3 context:
It looks like North-South traffic flow is operational!
Diagram
Let’s finish with a diagram of the routing topology I built so far:
Availability? Not really, but this is a lab environment. I do not recommend using this setup in a production environment. I will deploy another pfSense router and create additional BGP peerings to make my lab look more like a production deployment, but that’s for another time. 😉
Conclusion
In this part I deployed the Tier-0 logical router and configured North-South dynamic routing. After some basic verification and testing things seem to be working. This piece of NSX infrastructure is critical when it comes to logical networks being able to communicate with the physical network and vice versa.
In the next part I will continue setting up routing by deploying a Tier-1 logical router and some logical L2 networks.
Welcome back! I’m still busy installing NSX-T in my lab. I prepared the vSphere distributed switch, configured the NSX transport zones, and created the transit logical switches in part three. I will now continue with setting up the NSX transport nodes.
Hypervisor transport nodes
I’ll start with turning my ESXi hosts into NSX transport nodes. In part one I added my vCenter system to NSX Manager where it is called a “Compute Manager”. This connection between NSX Manager and vCenter comes in handy when deploying and configuring certain components of the NSX solution. This is definitely the case when preparing ESXi hosts.
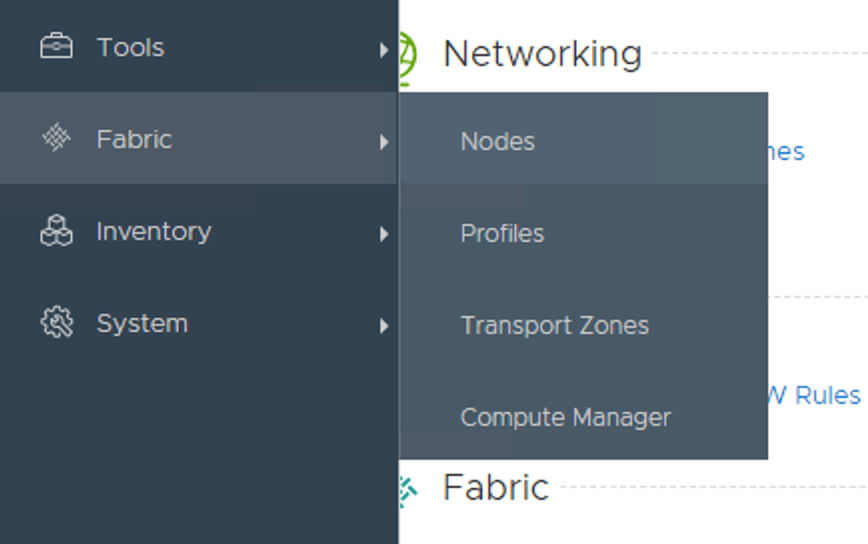
In NSX Manager I navigate to Fabric > Nodes:
Under the first tab “Hosts” I change the “Managed by” to my compute manager (my vCenter):
Once the compute manager is selected it shows the vSphere cluster and, when expanded, the ESXi hosts:
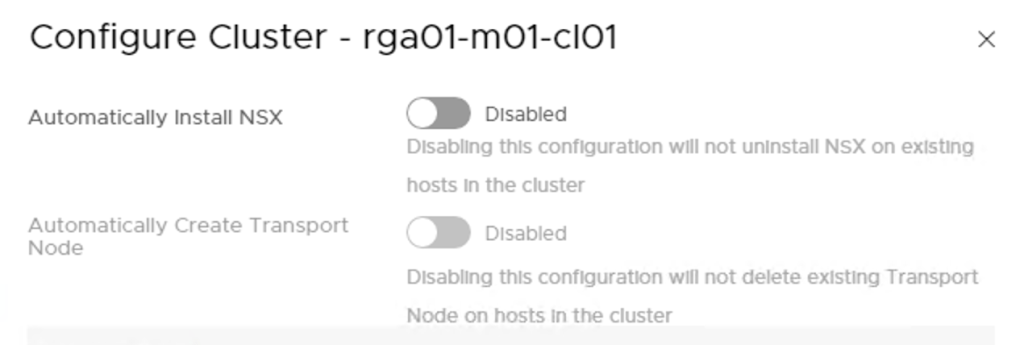
There are two ways I can go about installing NSX on my ESXi hosts. Either I install the VIBS on individual hosts, or I configure the installation on the cluster level. In my lab I’m going for the latter and click the “Configure Cluster” button.
Here I enable automatic installation of NSX which will automatically install the NSX VIBS to all ESXi hosts in the cluster. Managing installation on the cluster level allows for automatic creation of transport nodes as well. I’m a huge fan of automating so I enable this one too:
Some input is required here:
Transport Zone – my ESXi transport nodes participate in overlay networking so here I pick the “overlay01” transport zone.
Uplink Profile – A template for the ESXi hosts uplinks. I create a new uplink profile that matches my lab environment called “Overlay-Uplink-Profile”. I change the teaming policy to “Load balance source” and type “uplink-1,uplink2” under “Active Uplinks”. Finally I change the “Transport VLAN” to “1614”.
IP Assignment – Transport nodes doing overlay networking use tunnel endpoints (TEPs) where L2 frames are encapsulated and transported over L3 to other TEPs. TEPs need an IP address and it is here one configures how IP addresses should be assigned to the TEPs. I create an IP Pool called “tep-pool” with a range of “172.16.14.50 – 172.16.14.70” and CIDR “172.16.14.0/24” which is the IP subnet assigned to the transport VLAN (1614) in my lab environment.
Physical NICs – Here I specify the ESXi host’s physical NICs that will be used for NSX networking. In my environment the ESXi hosts have dedicated NICS for NSX networking. These are “vmnic2” which I map to “uplink-1” and “vmnic3” which I map to “uplink-2”.
Below a screen when all information is entered:
Once I click the “Add” button the NSX installation kicks off immediately:
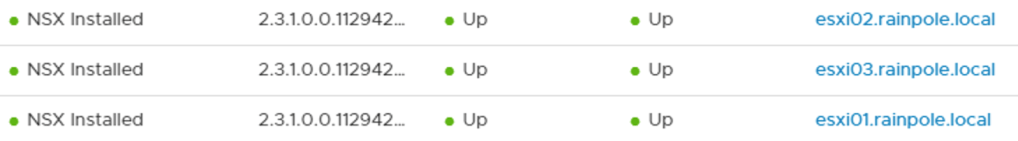
After a minute or so things are looking pretty good:
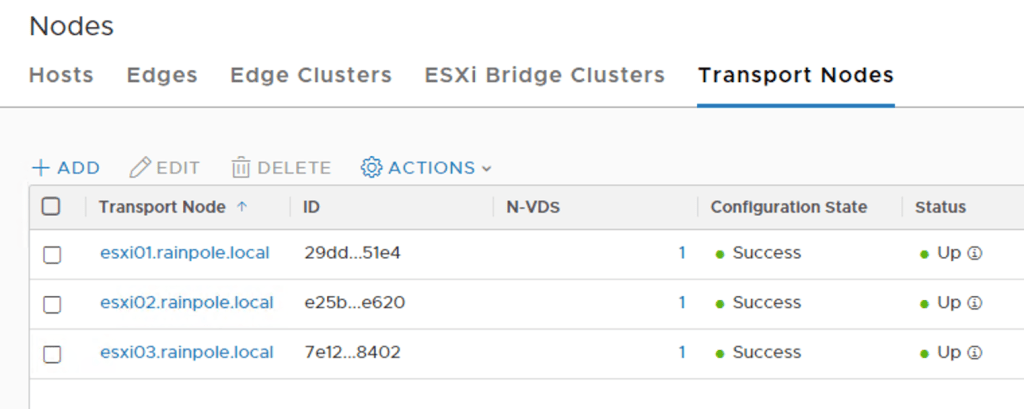
Under the “Transport Nodes” tab I see that the three ESXi hosts have been successfully configured as transport nodes:
Edge transport nodes
With the ESXi hosts prepared I’m moving on with the Edge. As the name implies the NSX Edge is where NSX meets the physical network. In my lab I’m going to deploy two Edge VMs.
I start by adding the following DNS records to DNS:
edge-01 – 172.16.11.58
edge-02 – 172.16.11.59
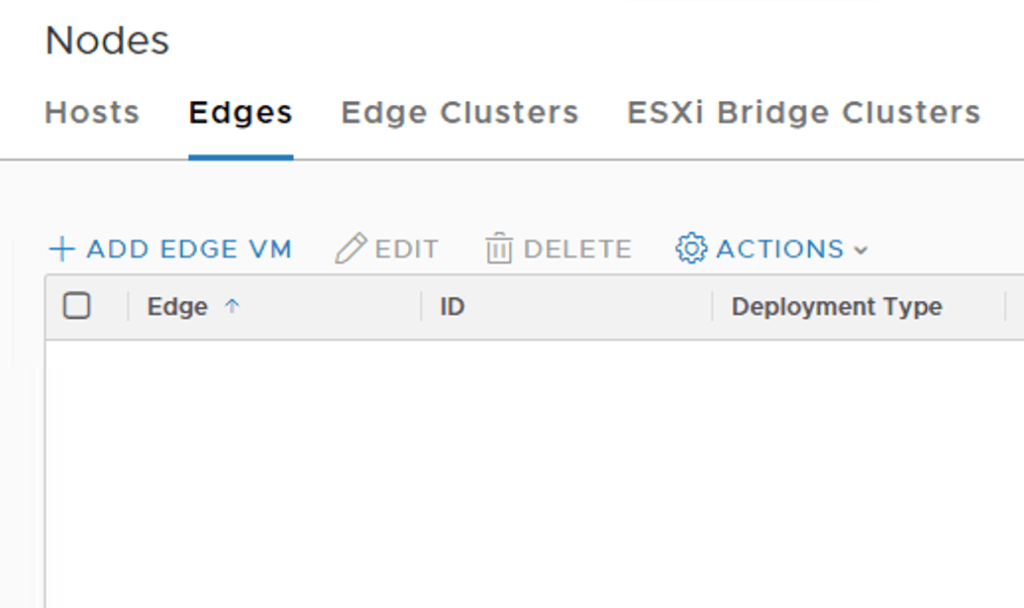
Next, in NSX Manager I navigate to Fabric > Nodes and click on the “Edges” tab:
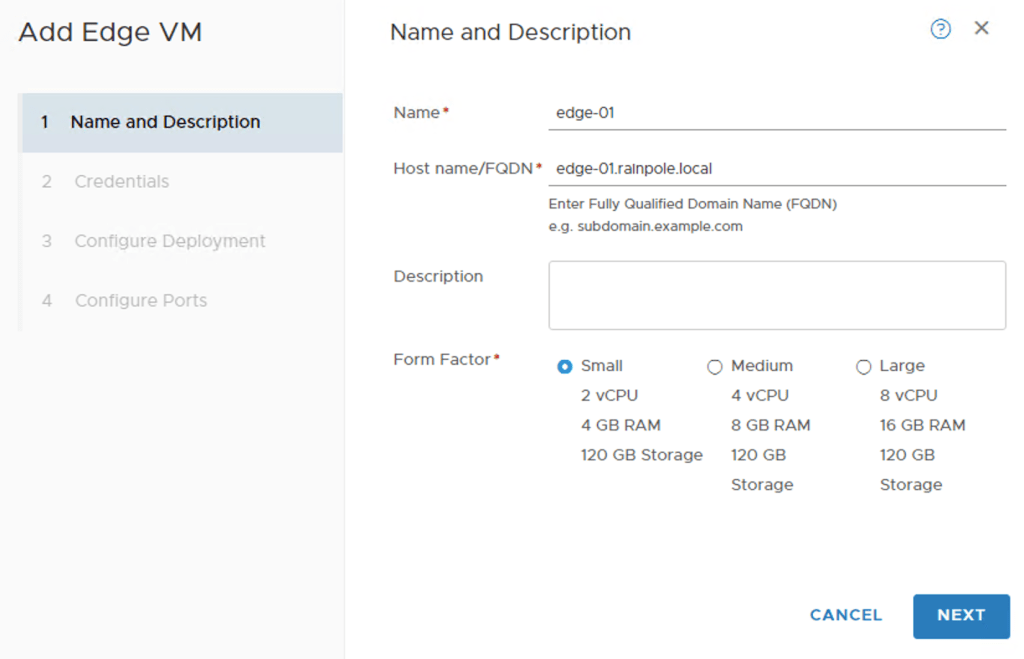
Here I click in the “+Add Edge VM” button. I fill out name and FQDN and choose to deploy a small Edge VM:
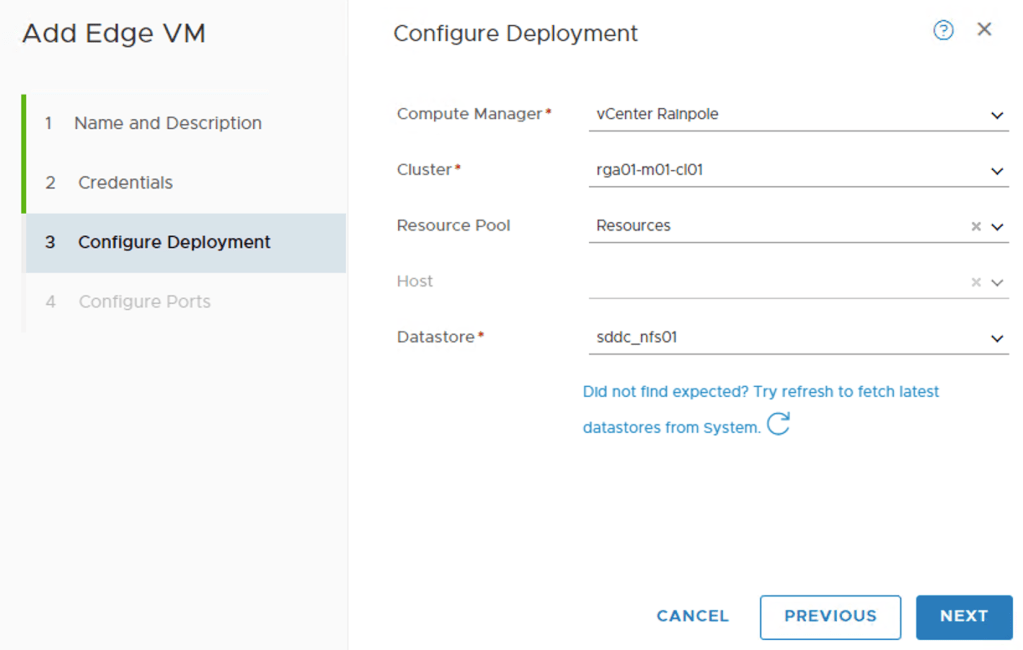
After clicking “Next” I need to specify some information about the vSphere environment where this Edge VM will be hosted. After I choose my compute manager I can pick the objects for cluster, resource pool, and datastore from the drop-down lists:
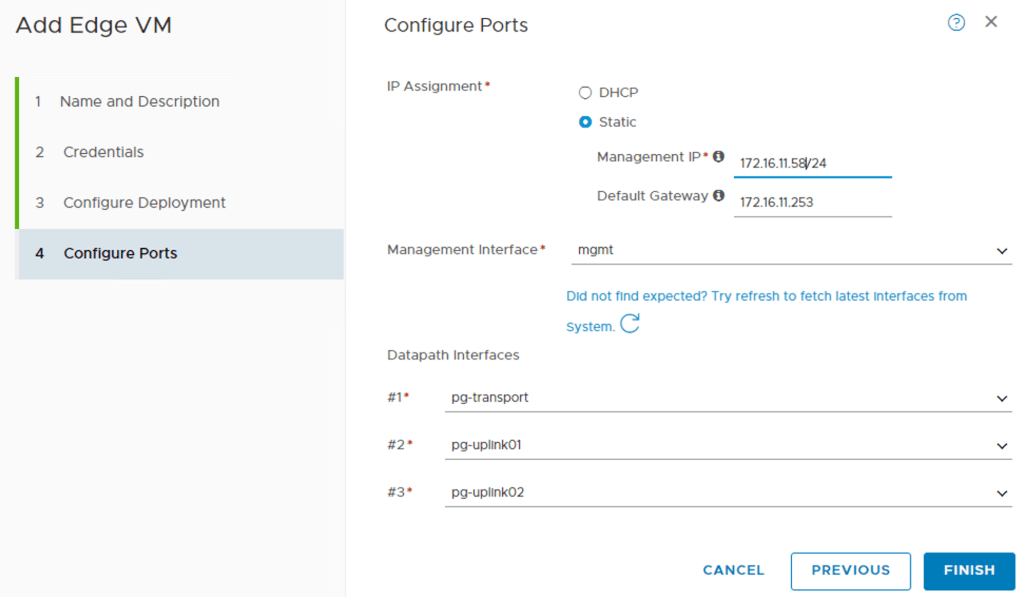
On the next page configure the network settings for the Edge VM:
First I specify the IP address, gateway, and port group for the Edge VM’s management interface. Then I configure the three so called “datapath” interfaces. These are the Edge VM’s interfaces that will be part of the data plane. I’m assigning interface #1 to the “pg-transport” port group, interface #2 to the “pg-uplink01” port group, and interface #3 to the “pg-uplink02” port group.
When I click “Finish” NSX Manager starts deploying the Edge VM right away.
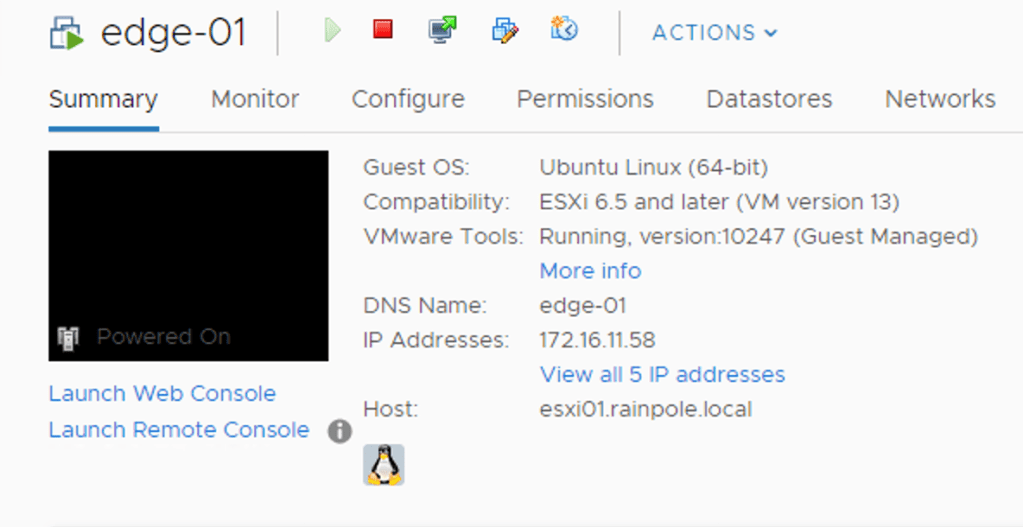
Having a look in vCenter shows me the new Edge virtual machine:
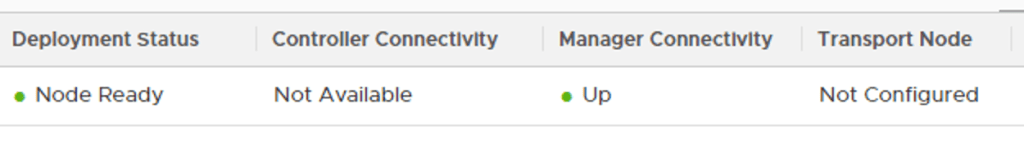
After a couple of minutes the Edge VM deployment is completed and has the following status:
The manager connectivity is up and running which is good. I still need to configure this Edge VM as a transport node before it can participate in actual NSX networking.
Before doing that I will deploy the second Edge VM. I basically repeat the steps above assigning IP address 172.16.11.59/24 to the management interface instead. Here are the two Edge VMs listed:
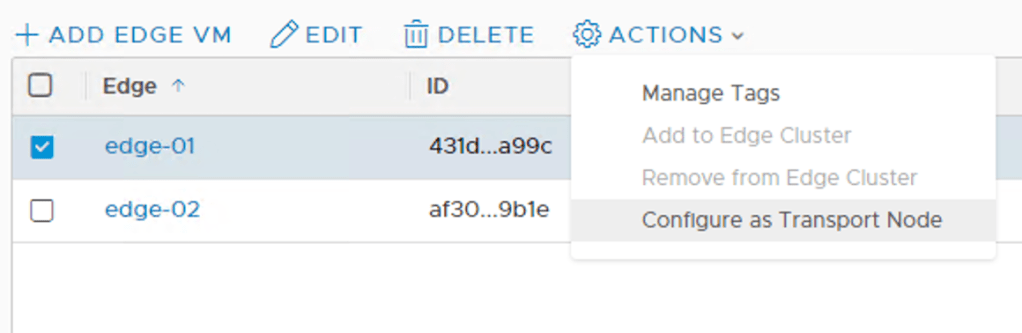
Now let’s configure them as transport nodes.
I select edge-01, click the “Actions” button, and choose “Configure as Transport Node”:
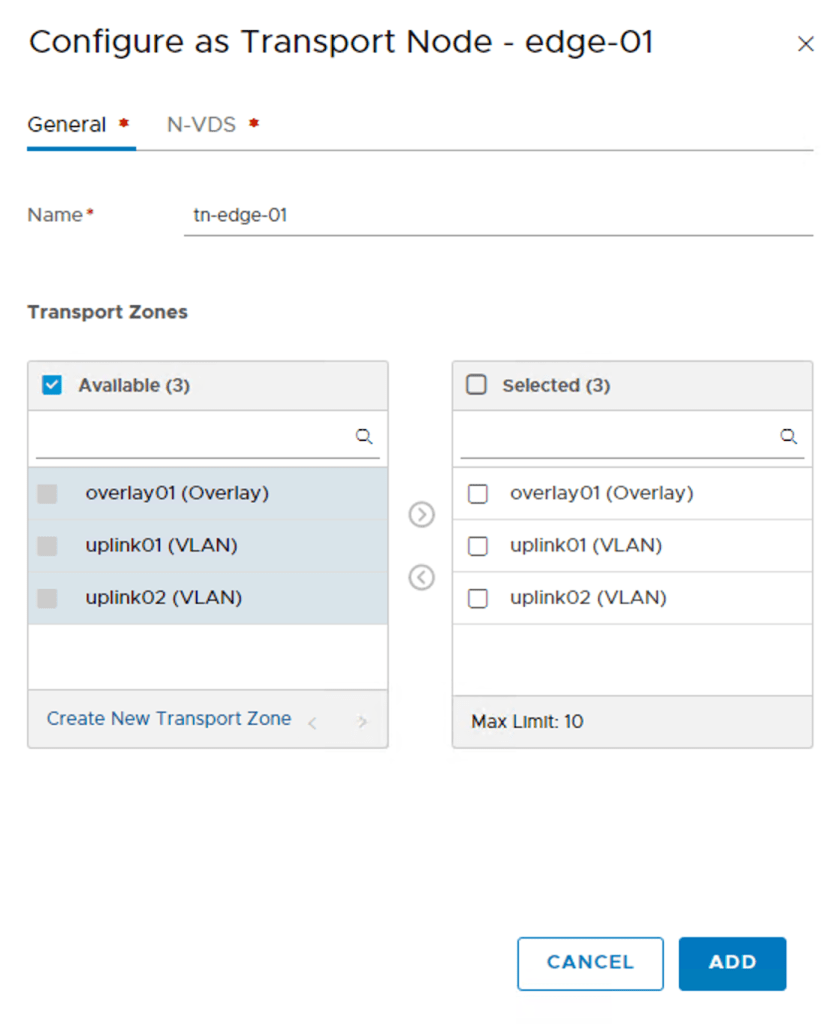
On the “General” screen I type a name for this transport node (tn-edge-01) and select the transport zones the Edge VM will be part of: overlay01, uplink01, and uplink02:
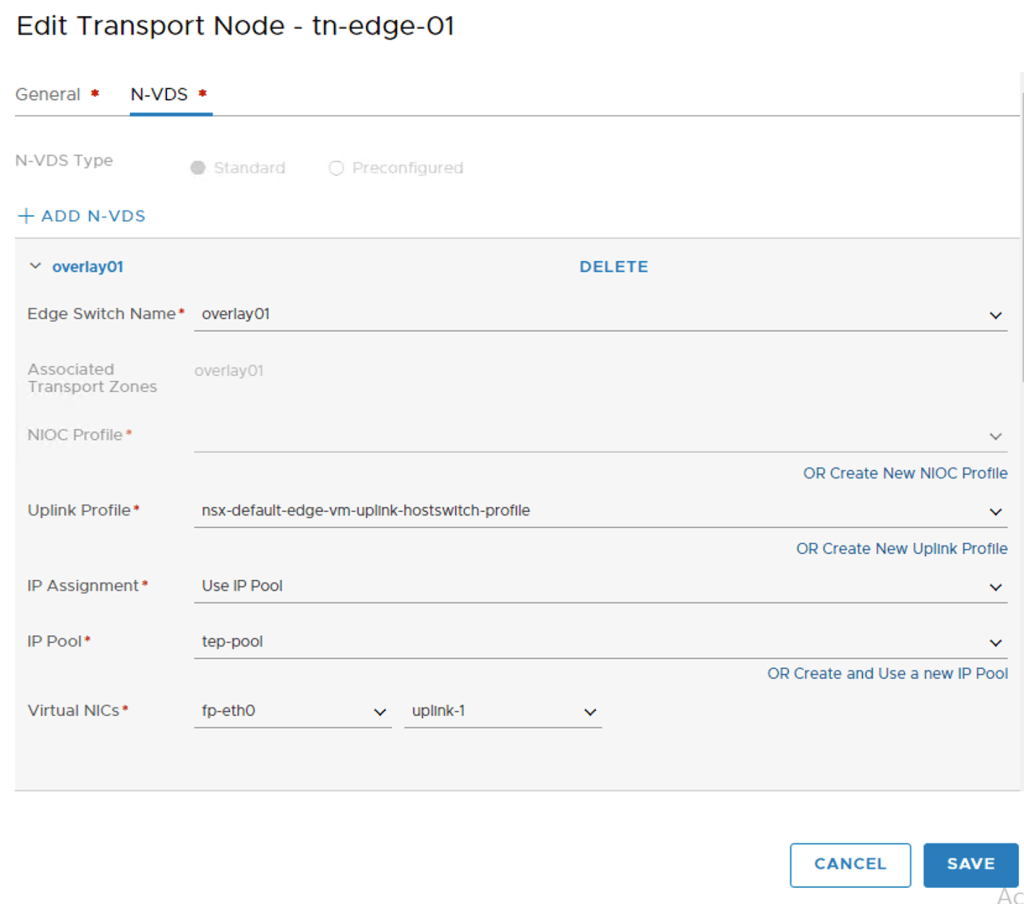
On the “N-VDS” tab I need to create an N-VDS for each of the selected transport zones.
I click on the “+ Add N-VDS” button and star configuring the first N-VDS “overlay01”:
I’m using the “nsx-default-edge-vm-uplink-hostswitch-profile” and the “tep-pool” IP pool to assign an IP address to the TEPs. Datapath virtual NIC “fp-eth0” is mapped to “uplink-1”.
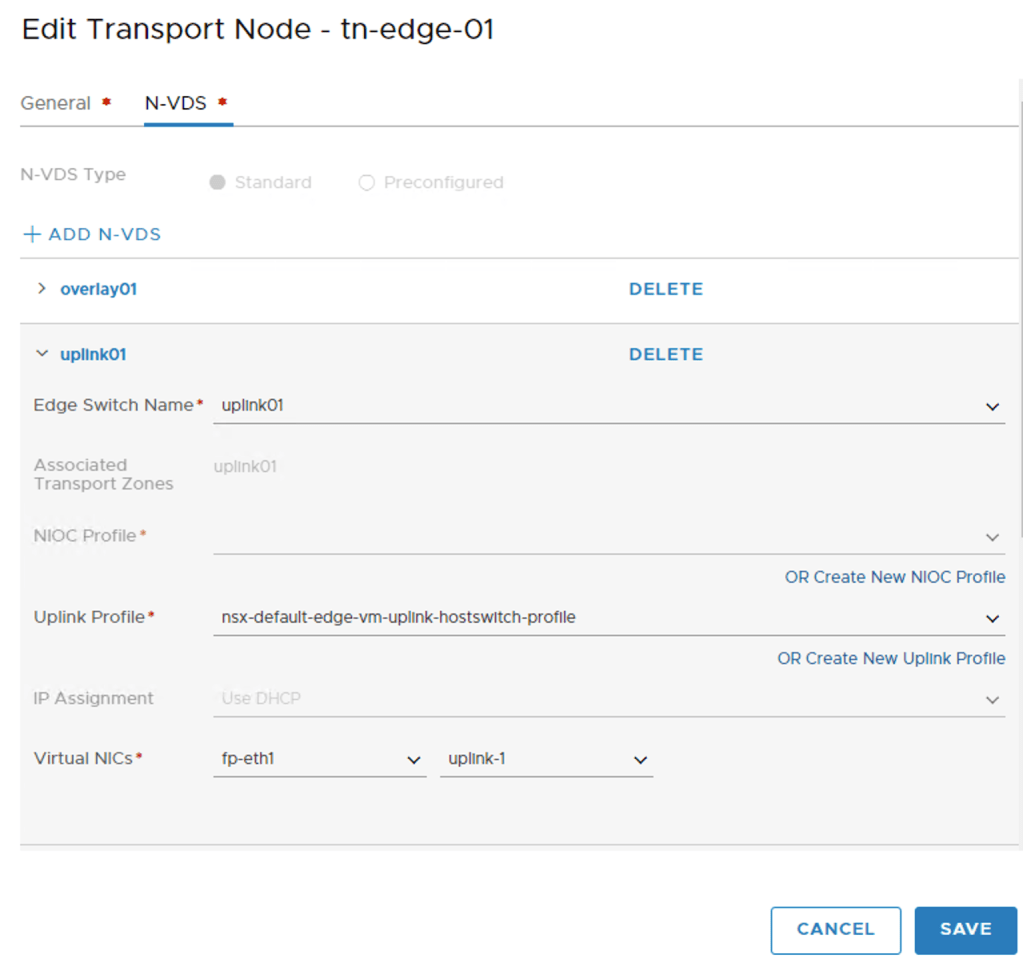
I click the “+ Add N-VDS” once more to create the second N-VDS called “uplink01”:
I choose “uplink01” as the switch name and map “fp-eth1” to “uplink-1” .
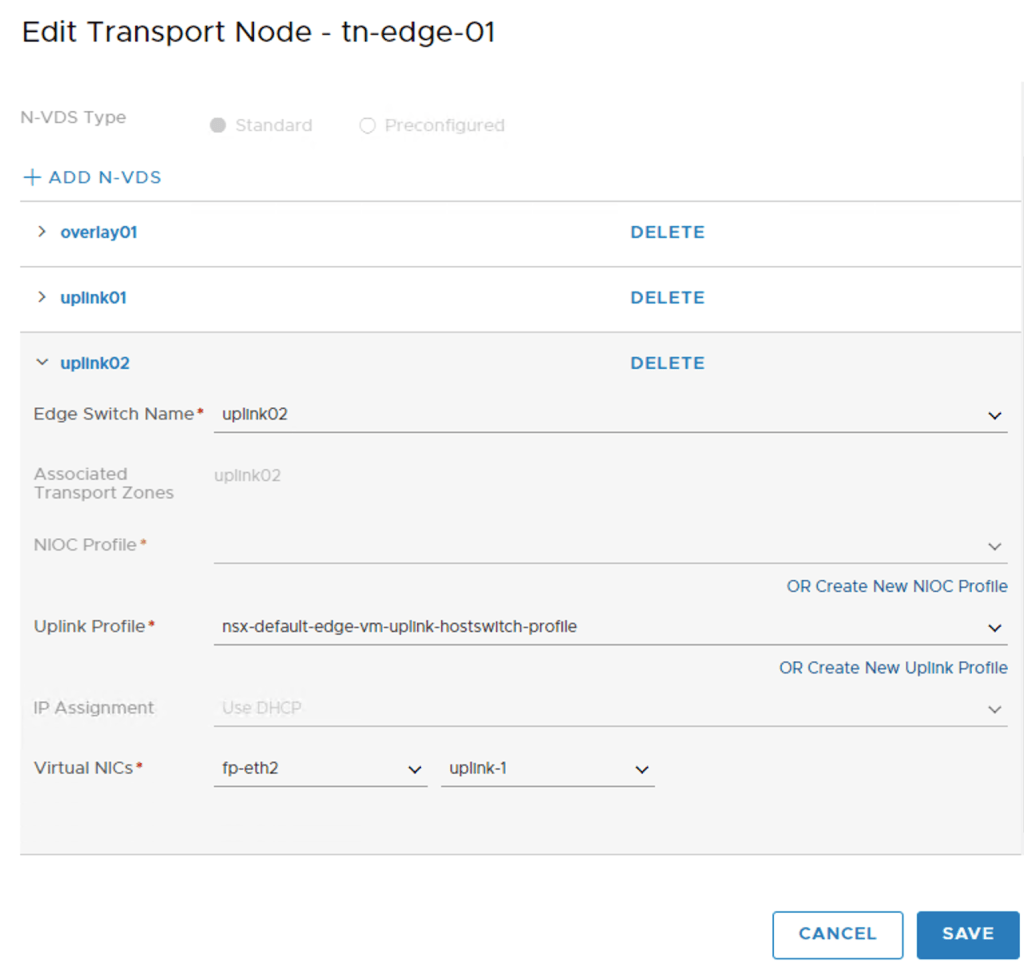
I click the “+ Add N-VDS” a third time to add the last N-VDS called “uplink02”:
I choose “uplink02” as the switch name and map “fp-eth2” to “uplink-1” .
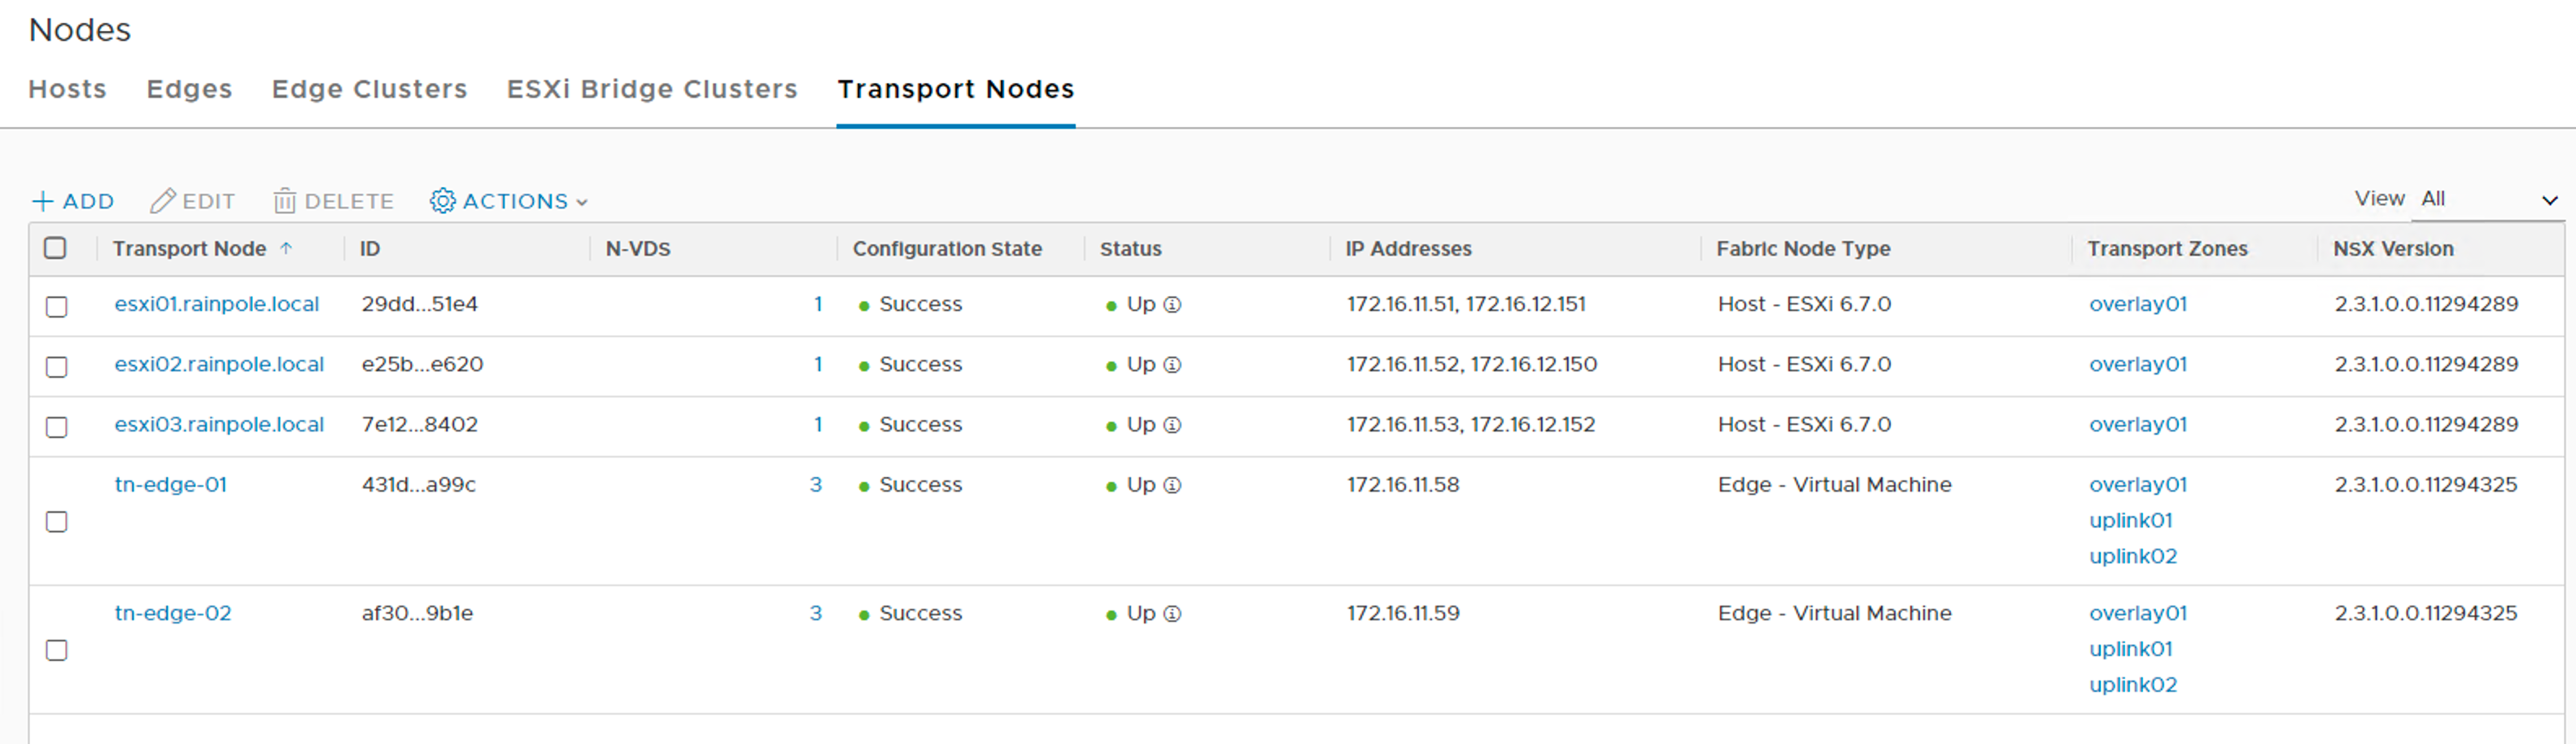
With the three N-VDS’s configured I click the “Save” button and the Edge VM is configured as a transport node. I repeat the above steps to configure the second edge “edge-02” as transport node “tn-edge-02”.
Both Edge VMs are now configured as transport nodes. Looking under Fabric > Nodes > Edges I can see that a connection with the controller cluster has been established and that each Edge vm has a transport node associated:
Looking under Fabric > Nodes > Transport Nodes I see five transport nodes. Three ESXi hosts and two Edge VMs:
There is one last thing I need to do and that is create an Edge Cluster. This is done under Fabric > Nodes > Edge Clusters.
I’m clicking the “+Add” button to start creating the Edge Cluster:
I add both of the edge transport nodes to “edge-cluster”. I click the “Add” button to finish the cluster creation. Edge cluster in place!
Conclusion
That was quite a bit of work, but now all the transport nodes are configured and everything should be in place to start doing some serious NSX networking. We’ll have a look at that in the next part. Until then, take care!
Welcome back! I’m in the middle of installing NSX-T in my vSphere lab environment. In part one I installed NSX Manager, in part two I deployed the NSX Controller Cluster. Now it’s time start working on what it’s all about: The data plane.
High-level overview
Setting up a complete NSX-T data plane involves installing and configuring several components. We have East-West distributed routing, North-South centralized routing, and security. Then there are the additional services like load balancing, NAT, DHCP and partner integrations.
The order in which you set things up depends primarily on what you’re trying to achieve. I noticed that different documents and guides also use different approaches.
So, I put together bits and pieces from different sources and came up with the following high-level plan for my NSX-T data plane deployment:
Prepare the vSphere distributed switch
Configure transport zones
Create logical switches
Prepare & configure ESXi hosts
Deploy & configure Edge VMs
Configure routing
In this article I will prepare the distributed switch, add the transport zones, and create the logical switches for the uplinks. Just to keep things digistible 🙂
Preparing the vSphere Distributed Switch
The NSX Edge VMs, that will be deployed later on, connect to four different VLANs: management, transport (carrying logical networks), and two uplink VLANs. I already have a distributed port group that maps to the management VLAN, so I need to create the ones for transport and the uplinks.
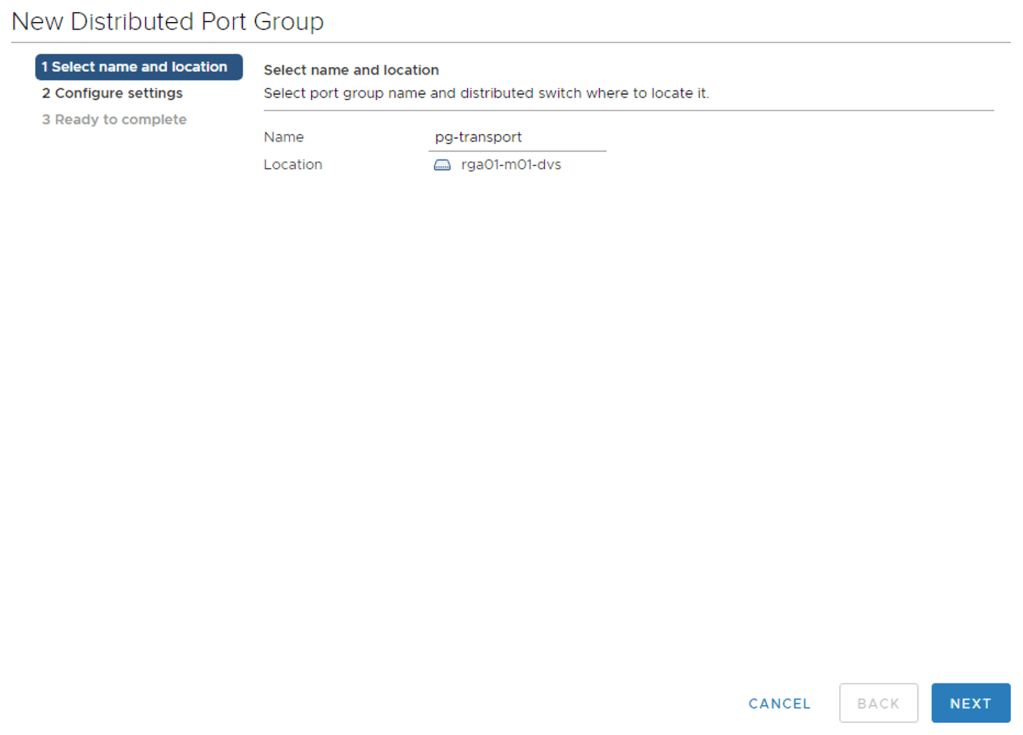
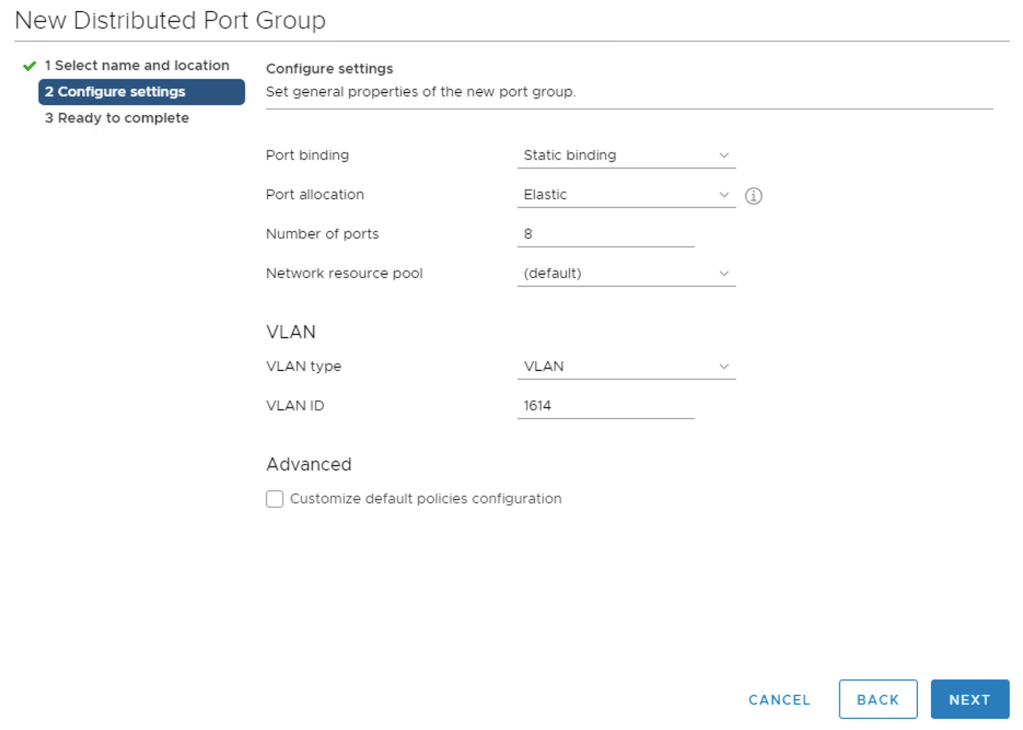
In vCenter, navigate to Networking, right-click the distributed switch and select Distributed Port Group > New Distributed Port Group. I’m calling this port group “pg-transport”.
On the next page I set “VLAN type” to “VLAN” and “VLAN ID” to “1614”. Click “Next” and finish the port group creation.
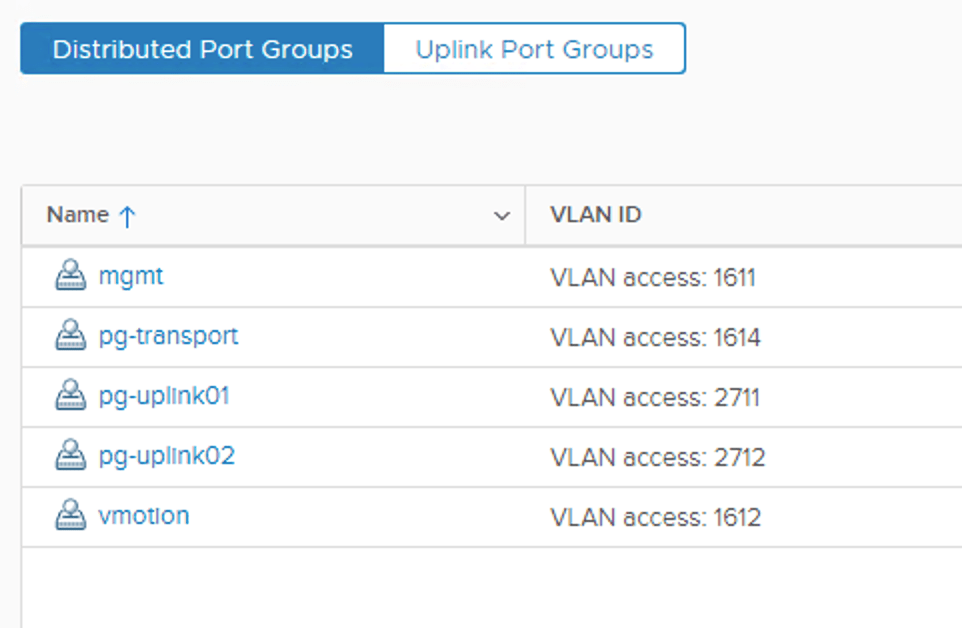
I repeat this process for the two port groups for the uplinks (VLAN 2711 and 2712). Once done it looks like this:
And the ESXi host’s network configuration now looks something like this:
Here I have the VDS with its 5 port groups as well as a pair of unused NICs which I will use for NSX networking later on.
Configuring NSX transport zones
Transport zones in NSX are containers that define the reach of the transport nodes. I briefly mentioned transports nodes in part two. Transport nodes are the hypervisor hosts and NSX Edges that participate in an NSX overlay. For hypervisor hosts, this means that its VMs can communicate over NSX logical switches. For NSX Edges, this means it will have logical router uplinks and downlinks.
My lab environment will start out with three transport zones: uplink01, uplink02, and overlay01.
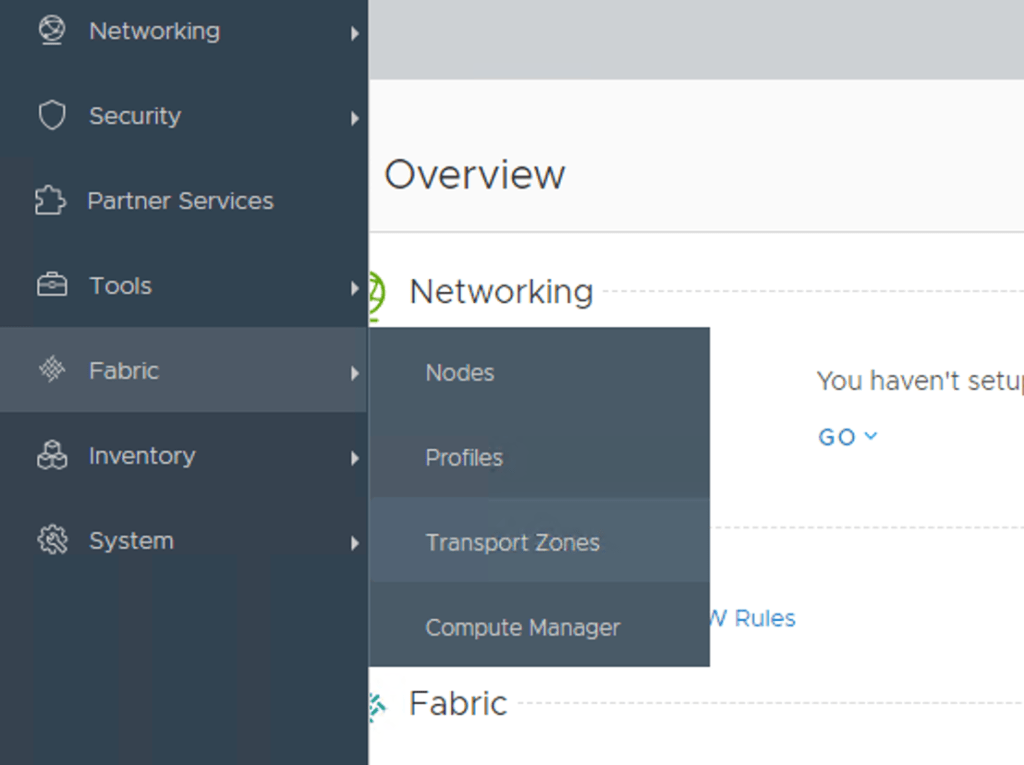
Log in to NSX Manager. In the menu at the left select Fabric > Transport Zones.
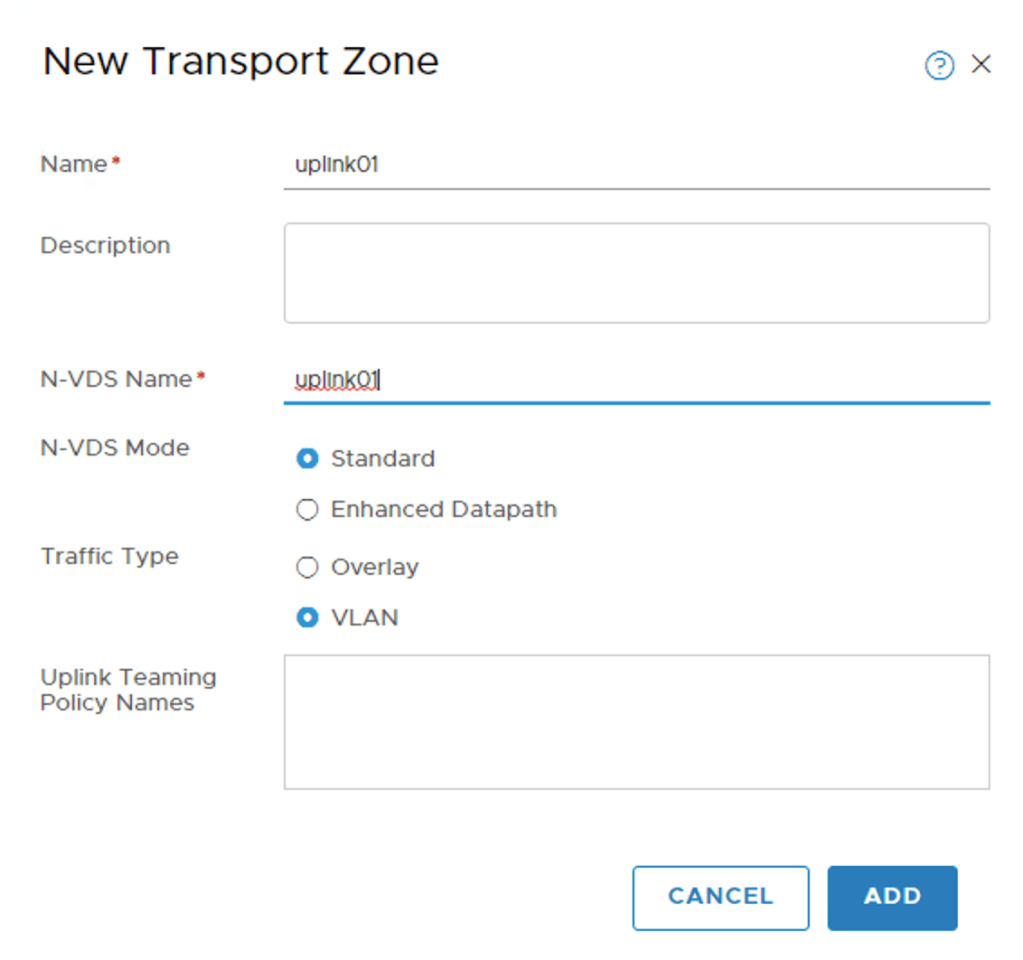
I start by creating a transport zone called “uplink01”. This is a VLAN transport zone that will be used by the NSX Edge later on:
I’m repeating this process to create the “uplink02” VLAN transport zone.
The third transport zone is an Overlay transport zone. It will be used by the host transport nodes and the NSX Edge:
The three transport zones listed:
Creating logical switches
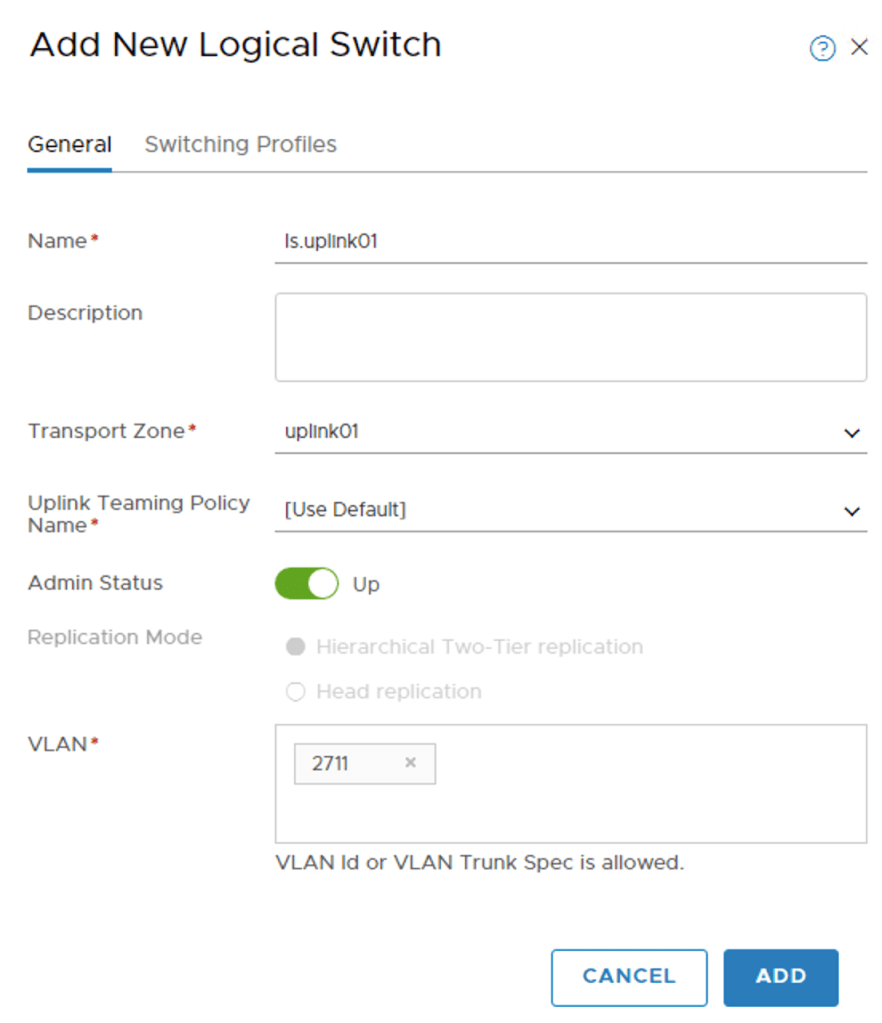
Next I’ll create two logical switches. These two will facilitate the transit between NSX and the pfSense router. In NSX Manager choose Networking > Switching.
The first logical switch, “ls-uplink01”, I add to transport zone “uplink01” and configured with VLAN 2711 :
I repeat this process to create a second logical switch called “ls-uplink02”. I add it to transport zone “uplink02” and configure it with VLAN Id 2712.
Conclusion
Taking small steps, but getting there. I created the necessary port groups on the vSphere distributed switch which are needed for the Edge VMs. I then went on to create the transport zones as well as two logical switches from NSX Manager.
In the next part I will continue with setting up the transport nodes; The ESXi hosts and the NSX Edge.