Avi Load Balancer offers a wealth of valuable metrics that can be accessed directly via the Avi Controller’s UI or API.
However, there are various reasons why you might want to make these metrics available outside of its native platform. For instance, you might wish to avoid granting users or systems direct access to the Avi Load Balancer management plane solely for metric consumption. Alternatively, you might need to store and analyze metrics in a centralized system or simply back them up for future use.
Fortunately, there are several methods for fetching metrics from the Avi Load Balancer and processing or storing them externally. In this article, I’ll guide you through the process of setting up an automated workflow where Avi Load Balancer metrics are fetched by Prometheus and visualized in Grafana.
Lab Environment
My lab environment for this exercise consists of the follow components:
- vSphere 8 Update 3
- A vSphere cluster with 3 ESXi hosts configured as Supervisor
- A TKG Service cluster (Kubernetes cluster) with 1 controlplane node and 3 worker nodes
- NSX 4.2.1.0 as the network stack
- Avi Load Balancer 30.2.2 with DNS virtual service
- Avi Kubernetes Operator (AKO)
- vSAN storage
Apart from the Avi Load Balancer, none of these components are strictly required. For all I know, this exercise could be performed using upstream Kubernetes on bare metal instead. However, this is how my lab is currently configured, and I wanted to share that setup for your reference.
High-Level Overview
Below is a simple high-level overview illustrating the workflow we’re going to build. It demonstrates how Avi Load Balancer metrics flow through the system, from collection to visualization, using Prometheus and Grafana.
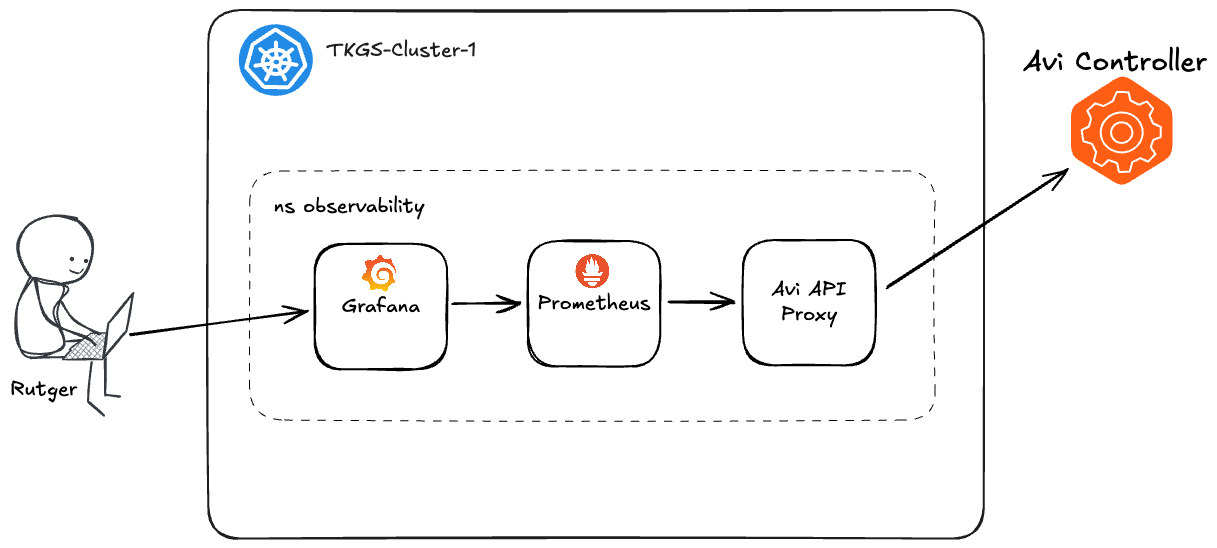
The various components—Grafana, Prometheus, and Avi API Proxy—will be deployed as pods within my Kubernetes cluster.
Let’s go!
Namespace
Keeping the components together in a dedicated namespace is my preferred approach in this case. This way, Prometheus can communicate with the Avi API Proxy using its Kubernetes-internal FQDN, and the same applies to communication between Grafana and Prometheus.
Create the observability namespace:
kubectl create ns observability
Deploying Components
Now, we can begin deploying the various components within this namespace.
Avi API Proxy
The Avi API Proxy is not a required component, but I recommend using it. Without the proxy, Prometheus would need to communicate directly with the Avi Controller. This would require enabling Basic Auth on the Avi Controller, which might not be desirable. There are additional advantages, as outlined in the official documentation. Essentially, by placing a proxy between the Avi Controller and Prometheus, we abstract away some complexity, resulting in a cleaner and more manageable solution.
The official documentation also references a Docker container. However, since I want to deploy the Avi API Proxy as a pod in Kubernetes, the manifest for the deployment I came up with (including the method to expose it) looks like this:
##
## avi-api-proxy-deployment.yaml
##
apiVersion: apps/v1
kind: Deployment
metadata:
  name: avi-api-proxy
  namespace: observability
  labels:
    app: avi-api-proxy
spec:
  replicas: 1
  selector:
    matchLabels:
      app: avi-api-proxy
  template:
    metadata:
      labels:
        app: avi-api-proxy
    spec:
      containers:
      - name: avi-api-proxy
        image: avinetworks/avi-api-proxy:latest
        ports:
        - containerPort: 8080
        env:
        - name: AVI_CONTROLLER
          value: "10.203.240.15"
        - name: AVI_USERNAME
          value: "prometheus"
        - name: AVI_PASSWORD
          value: "VMware1!"
        - name: AVI_TIMEOUT
          value: "60"
---
apiVersion: v1
kind: Service
metadata:
  name: avi-api-proxy-service
  namespace: observability
  labels:
    app: avi-api-proxy
spec:
  selector:
    app: avi-api-proxy
  ports:
  - protocol: TCP
    port: 8080
    targetPort: 8080
You’ll have to update the values for AVI_CONTROLLER, AVI_USERNAME, and AVI_PASSWORD . After that you should be good to go:
kubectl apply -f avi-api-proxy-deployment.yaml
Verify that the deployment and service are up and running:
kubectl get deployments -n observability avi-api-proxy && kubectl get svc -n observability avi-api-proxy-service
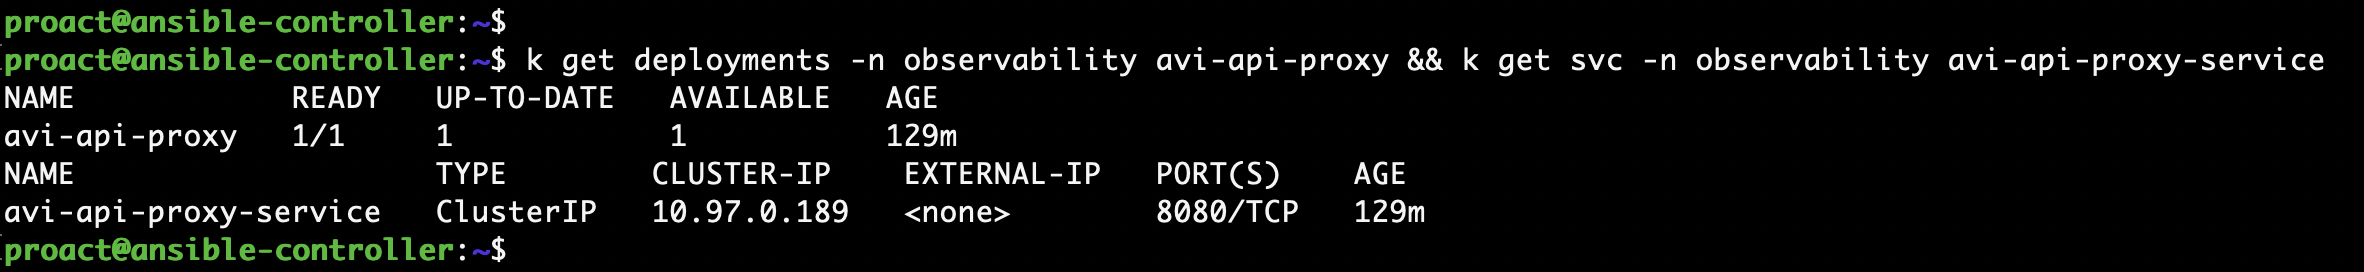
Looking good!
Prometheus ConfigMap
Prometheus uses a configuration file in YAML format. Since we’re deploying Prometheus in Kubernetes, we’ll add the contents of our specific configuration file as a ConfigMap within our namespace. We’ll then instruct Prometheus to look for the configuration in that ConfigMap:
##
## prometheus-configmap.yaml
##
apiVersion: v1
kind: ConfigMap
metadata:
  name: prometheus-server-conf
  labels:
    name: prometheus-server-conf
  namespace: observability
data:
  prometheus.yml: |-
    global:
      scrape_interval: 15s
      evaluation_interval: 15s
    rule_files:
      - /etc/prometheus/prometheus.rules
    scrape_configs:
      - job_name: avi_api_vs1  ## Job name
        honor_timestamps: true
        params:
          tenant:
          - admin   ## Tenant Names to be mentioned comma separated
        scrape_interval: 1m ## scrape interval
        scrape_timeout: 45s ## scrape timeout
        metrics_path: /api/analytics/prometheus-metrics/virtualservice ## VirtualService metrics collected
        scheme: http
        follow_redirects: true
        metric_relabel_configs:  ## config to replace the controller instance name
        - source_labels: [instance]
          separator: ;
          regex: (.*)
          target_label: instance
          replacement: pod-240-alb-controller ## replacement name to be used
          action: replace
        static_configs:
        - targets:
          - avi-api-proxy-service.observability.svc:8080 ## avi-api-proxy container ip address and port
      - job_name: avi_api_se_specific
        honor_timestamps: true
        params:
          metric_id:
          - se_if.avg_bandwidth,se_if.avg_rx_pkts,se_if.avg_rx_bytes,se_if.avg_tx_bytes,se_if.avg_tx_pkts  ## Specific SE metrics which are collected
          tenant:
          - admin
        scrape_interval: 1m
        scrape_timeout: 45s
        metrics_path: /api/analytics/prometheus-metrics/serviceengine   ## Metrics path for  Service Engine
        scheme: http
        follow_redirects: true
        metric_relabel_configs:
        - source_labels: [instance]
          separator: ;
          regex: (.*)
          target_label: instance
          replacement: pod-240-alb-controller
          action: replace
        static_configs:
        - targets:
          - avi-api-proxy-service.observability.svc:8080
      - job_name: avi_api_se
        honor_timestamps: true
        params:
          tenant:
          - admin
        scrape_interval: 1m
        scrape_timeout: 45s
        metrics_path: /api/analytics/prometheus-metrics/serviceengine ## Metrics path for  Service Engine
        scheme: http
        follow_redirects: true
        metric_relabel_configs:
        - source_labels: [instance]
          separator: ;
          regex: (.*)
          target_label: instance
          replacement: pod-240-alb-controller
          action: replace
        static_configs:
        - targets:
          - avi-api-proxy-service.observability.svc:8080
      - job_name: avi_api_pool
        honor_timestamps: true
        params:
          tenant:
          - admin
        scrape_interval: 1m
        scrape_timeout: 45s
        metrics_path: /api/analytics/prometheus-metrics/pool  ## Metrics path for Pool
        scheme: http
        follow_redirects: true
        metric_relabel_configs:
        - source_labels: [instance]
          separator: ;
          regex: (.*)
          target_label: instance
          replacement: pod-240-alb-controller
          action: replace
        static_configs:
        - targets:
          - avi-api-proxy-service.observability.svc:8080
      - job_name: avi_api_controller
        honor_timestamps: true
        scrape_interval: 1m
        scrape_timeout: 45s
        metrics_path: /api/analytics/prometheus-metrics/controller  ## Metrics path for Avi Controller
        scheme: http
        follow_redirects: true
        metric_relabel_configs:
        - source_labels: [instance]
          separator: ;
          regex: (.*)
          target_label: instance
          replacement: pod-240-alb-controller
          action: replace
        static_configs:
        - targets:
          - avi-api-proxy-service.observability.svc:8080
You’ll want to replace pod-240-alb-controller with the name of your Avi Load Balancer Controller.
Note that we’re targeting the Avi API Proxy service and addressing it by its internal FQDN: avi-api-proxy-service.observability.svc
Create the ConfigMap:
kubectl apply -f prometheus-configmap.yaml
Prometheus
The manifest for the Prometheus deployment looks like this:
##
## prometheus-deployment.yaml
##
apiVersion: apps/v1
kind: Deployment
metadata:
  name: prometheus-deployment
  namespace: observability
  labels:
    app: prometheus-server
spec:
  replicas: 1
  selector:
    matchLabels:
      app: prometheus-server
  template:
    metadata:
      labels:
        app: prometheus-server
    spec:
      containers:
        - name: prometheus
          image: prom/prometheus
          args:
            - "--storage.tsdb.retention.time=12h"
            - "--config.file=/etc/prometheus/prometheus.yml"
            - "--storage.tsdb.path=/prometheus/"
          ports:
            - containerPort: 9090
          resources:
            requests:
              cpu: 500m
              memory: 500M
            limits:
              cpu: 1
              memory: 1Gi
          volumeMounts:
            - name: prometheus-config-volume
              mountPath: /etc/prometheus/
            - name: prometheus-storage-volume
              mountPath: /prometheus/
      volumes:
        - name: prometheus-config-volume
          configMap:
            defaultMode: 420
            name: prometheus-server-conf
        - name: prometheus-storage-volume
          emptyDir: {}
---
apiVersion: v1
kind: Service
metadata:
  name: prometheus-service
  namespace: observability
  annotations:
      prometheus.io/scrape: 'true'
      prometheus.io/port:   '9090'
spec:
  selector:
    app: prometheus-server
  ports:
    - port: 9090
      protocol: TCP
      targetPort: 9090
Note that the contents of the ConfigMap are made accessible to Prometheus via a volume.
Deploy Prometheus:
kubectl apply -f prometheus-deployment.yaml
Check the result:
kubectl get deployments -n observability prometheus-deployment && kubectl get svc -n observability prometheus-service
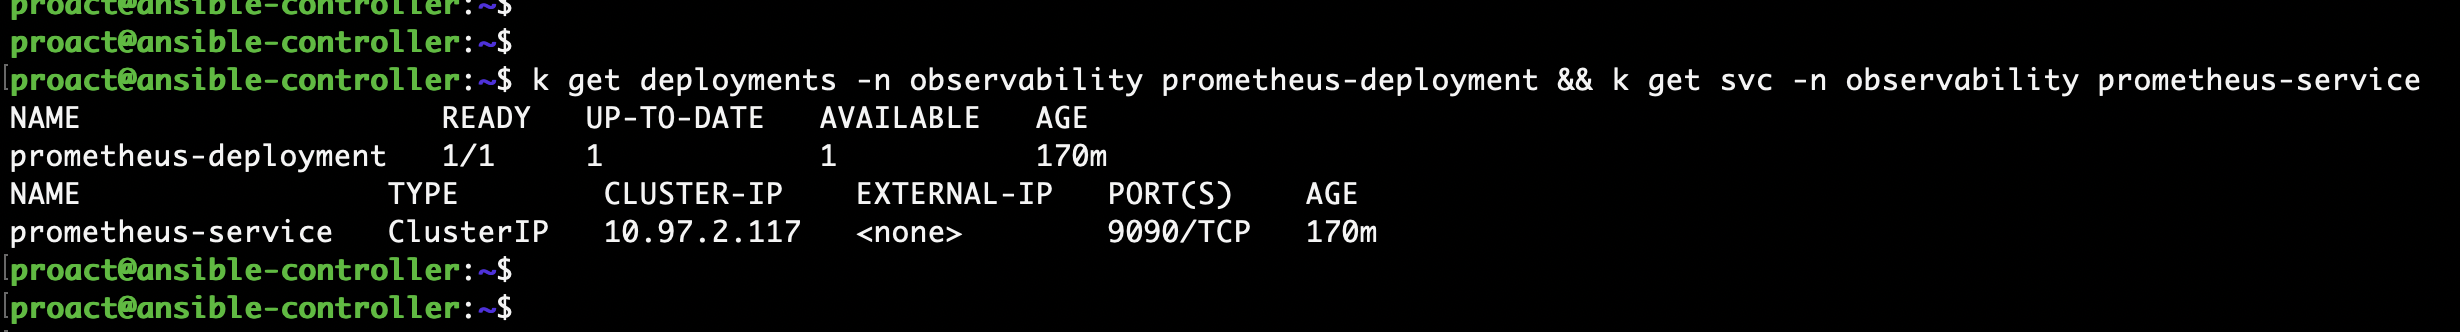
We’re good.
Ingress for Prometheus (optional)
This is optional, but Prometheus has a web UI that can be quite handy from time to time. Additionally, since I have the Avi Kubernetes Operator (AKO) configured in my cluster, it’s easy to create an Ingress for the Prometheus service.
##
## prometheus-ingress.yaml
##
apiVersion: networking.k8s.io/v1
kind: Ingress
metadata:
  name: prometheus-ingress
  namespace: observability
spec:
  ingressClassName: avi-lb
  rules:
    - host: prometheus.ako.lab
      http:
        paths:
        - path: /
          pathType: Prefix
          backend:
            service:
              name: prometheus-service
              port:
                number: 9090
kubectl apply -f prometheus-ingress.yaml
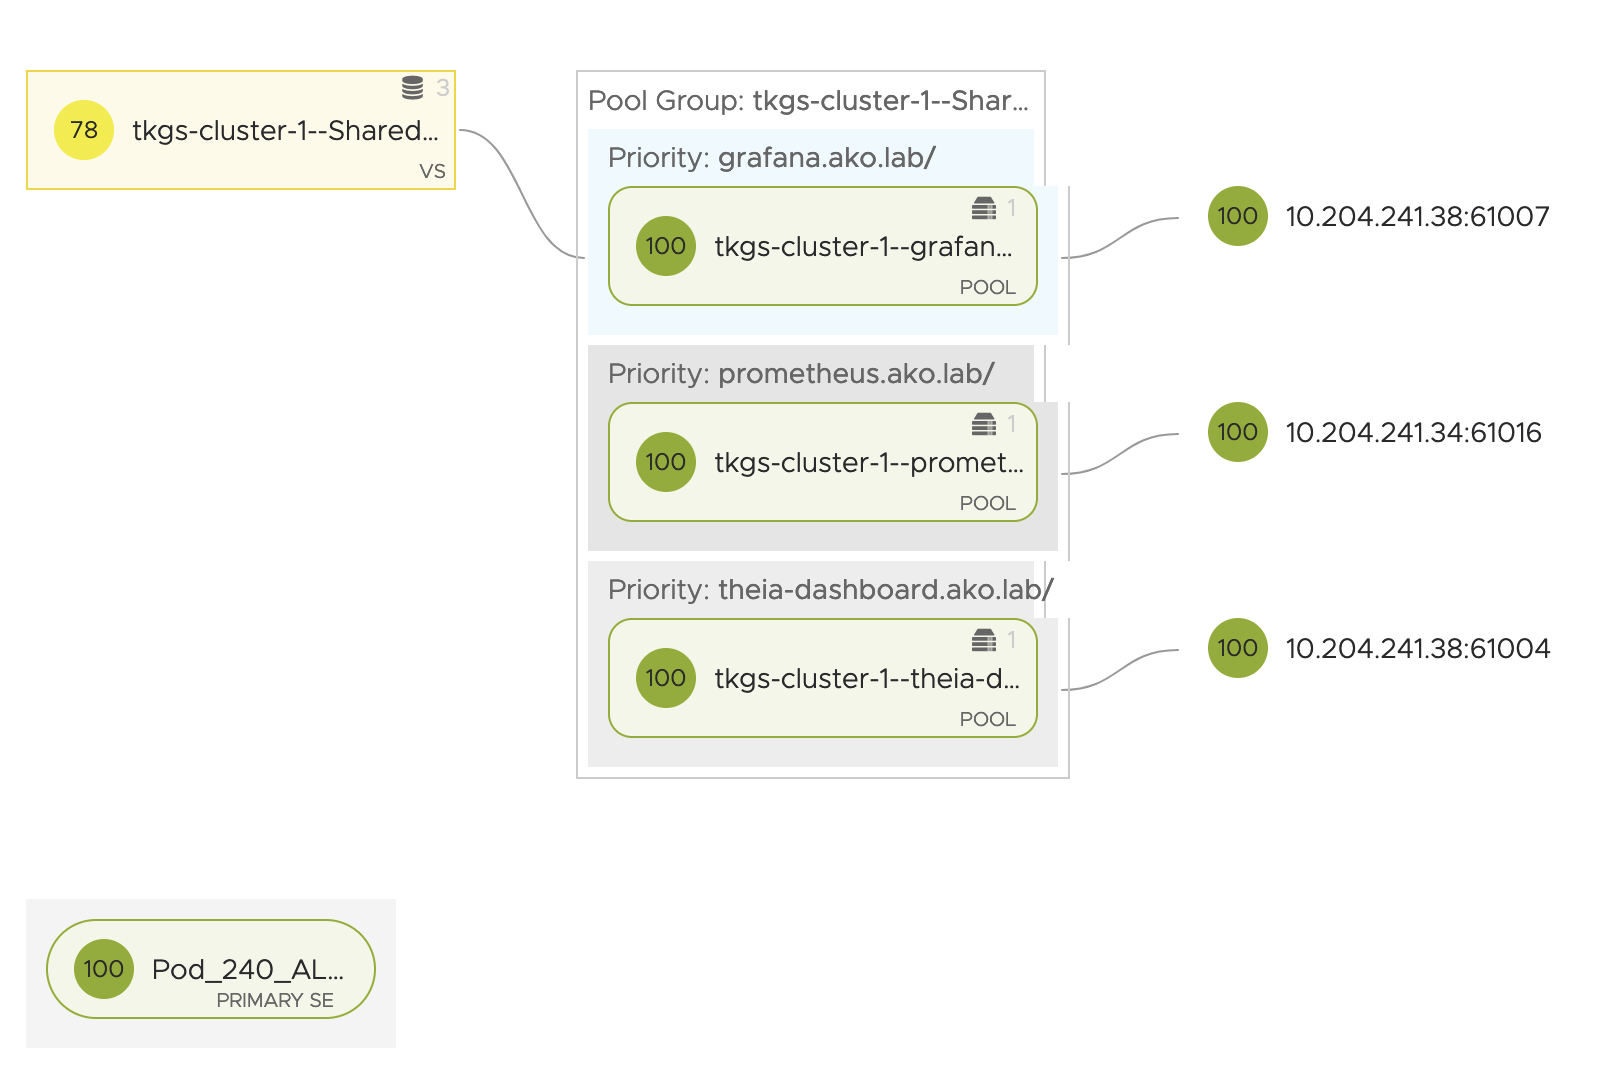
The prometheus.ako.lab and several other Ingress hosted by Avi Load Balancer in my lab:
Grafana ConfigMap
Grafana is the component that transforms our Prometheus metrics into visually appealing graphs, making it easier to interpret the data.
The configuration we need to inject into our Grafana instance is the Prometheus data source. To do this, we’ll use the following ConfigMap:
##
## grafana-configmap.yaml
##
apiVersion: v1
kind: ConfigMap
metadata:
  name: grafana-datasources
  namespace: observability
data:
  prometheus.yaml: |-
    {
        "apiVersion": 1,
        "datasources": [
            {
               "access":"proxy",
                "editable": true,
                "name": "Prometheus",
                "orgId": 1,
                "type": "prometheus",
                "url": "http://prometheus-service.observability.svc:9090",
                "version": 1
            }
        ]
    }
Grafana will use Prometheus’s internal FQDN to access the service: prometheus-service.observability.svc
Create the ConfigMap:
kubectl apply -f grafana-configmap.yaml
Grafana
Finally, we deploy Grafana using this manifest:
##
## grafana-deployment.yaml
##
apiVersion: apps/v1
kind: Deployment
metadata:
  name: grafana
  namespace: observability
spec:
  replicas: 1
  selector:
    matchLabels:
      app: grafana
  template:
    metadata:
      name: grafana
      labels:
        app: grafana
    spec:
      containers:
      - name: grafana
        image: grafana/grafana:latest
        ports:
        - name: grafana
          containerPort: 3000
        resources:
          limits:
            memory: "1Gi"
            cpu: "1000m"
          requests:
            memory: 500M
            cpu: "500m"
        volumeMounts:
          - mountPath: /var/lib/grafana
            name: grafana-storage
          - mountPath: /etc/grafana/provisioning/datasources
            name: grafana-datasources
            readOnly: false
      volumes:
        - name: grafana-storage
          emptyDir: {}
        - name: grafana-datasources
          configMap:
              defaultMode: 420
              name: grafana-datasources
---
apiVersion: v1
kind: Service
metadata:
  name: grafana-service
  namespace: observability
  annotations:
      prometheus.io/scrape: 'true'
      prometheus.io/port:   '3000'
spec:
  selector:
    app: grafana
  ports:
    - port: 3000
      protocol: TCP
      targetPort: 3000
Validate the result:
kubectl get deployments -n observability grafana && kubectl get svc -n observability grafana-service

Ingress for Grafana (optional)
Creating an Ingress for the Grafana service is also optional. If you want to access this Grafana instance from outside the Kubernetes cluster, there are several ways to achieve that. In my case, I’ll create an Ingress and let AKO handle the rest. 😉
##
## grafana-ingress.yaml
##
apiVersion: networking.k8s.io/v1
kind: Ingress
metadata:
  name: grafana
  namespace: observability
spec:
  ingressClassName: avi-lb
  rules:
    - host: grafana.ako.lab
      http:
        paths:
        - path: /
          pathType: Prefix
          backend:
            service:
              name: grafana-service
              port:
                number: 3000
Grafana Dashboards
At this point, we should have a working solution. Prometheus is fetching and storing Avi Load Balancer metrics through the Avi API Proxy, while Grafana is configured with the Prometheus data source and ready to visualize the data using dashboards.
Speaking of dashboards, I found some deep down in the devops repository of Avi Networks GitHub that work out-of-the-box with what we’ve set up here. There are a total of six dashboards::
- Avi-Controller.json
- Avi-Pool-Specific.json
- Avi-Service-Engine-Specific.json
- Avi-Service-Engines-Total.json
- Avi-Virtual-Services-Specific.json
- Avi-Virtual-Services-Total.json
Make sure to download these files, then log in to Grafana and import them as dashboards:

Once all the files have been imported, you should see something similar to this:

You can click through the slideshow below to view a screenshot of each dashboard:


Summary
In this article, we explored the steps for configuring an automated workflow that collects Avi Load Balancer metrics using Prometheus via the Avi API Proxy and visualization through Grafana dashboards. All components were deployed as containers within a dedicated Kubernetes namespace.
This simple solution was implemented in an isolated lab environment. Deploying it in a production environment would require additional considerations, such as externalization, persistence, security, backup strategies, and adherence to Kubernetes best practices.
The YAML manifests that I used in this exercise can be found in my GitHub repository.
Hopefully this article gave you some inspiration on your network observability journey.
Thank you for reading! Feel free to share your thoughts or ask questions in the comments below or just reach out to me directly.
References:
How to Setup Prometheus Monitoring On Kubernetes Cluster
Avi Load Balancer Prometheus Integration

Leave a reply to Adi Tanase Cancel reply