TKG Service Clusters using the default Antrea CNI, can be easily configured for enhanced network visibility through flow visualization and monitoring.
The ability to monitor network traffic within your Kubernetes clusters, as well as between your Kubernetes constructs and the outside world, is essential for understanding system behavior—and especially important when things aren’t working as intended.
In this article, I’ll walk you through the steps to enable network visibility specifically for TKG Service Clusters. However, similar steps can be applied to any Kubernetes cluster that is using the Antrea CNI.
Bill of Materials
My lab environment for this exercise consists of the follow components:
- vSphere 8 Update 3
- A vSphere cluster with 3 ESXi hosts configured as Supervisor
- A TKG Service cluster with 1 controlplane node and 3 worker nodes
- NSX 4.2.1.0 as the network stack
- Avi Load Balancer 30.2.2 with DNS virtual service
- Avi Kubernetes Operator (AKO)
- vSAN storage
Note: Neither Avi Kubernetes Operator (AKO) nor Avi Load Balancer are required components, but you’ll most likely run into these when working with production vSphere Supervisor environments.
Diagram
The diagram below provides a high-level overview of the lab environment.
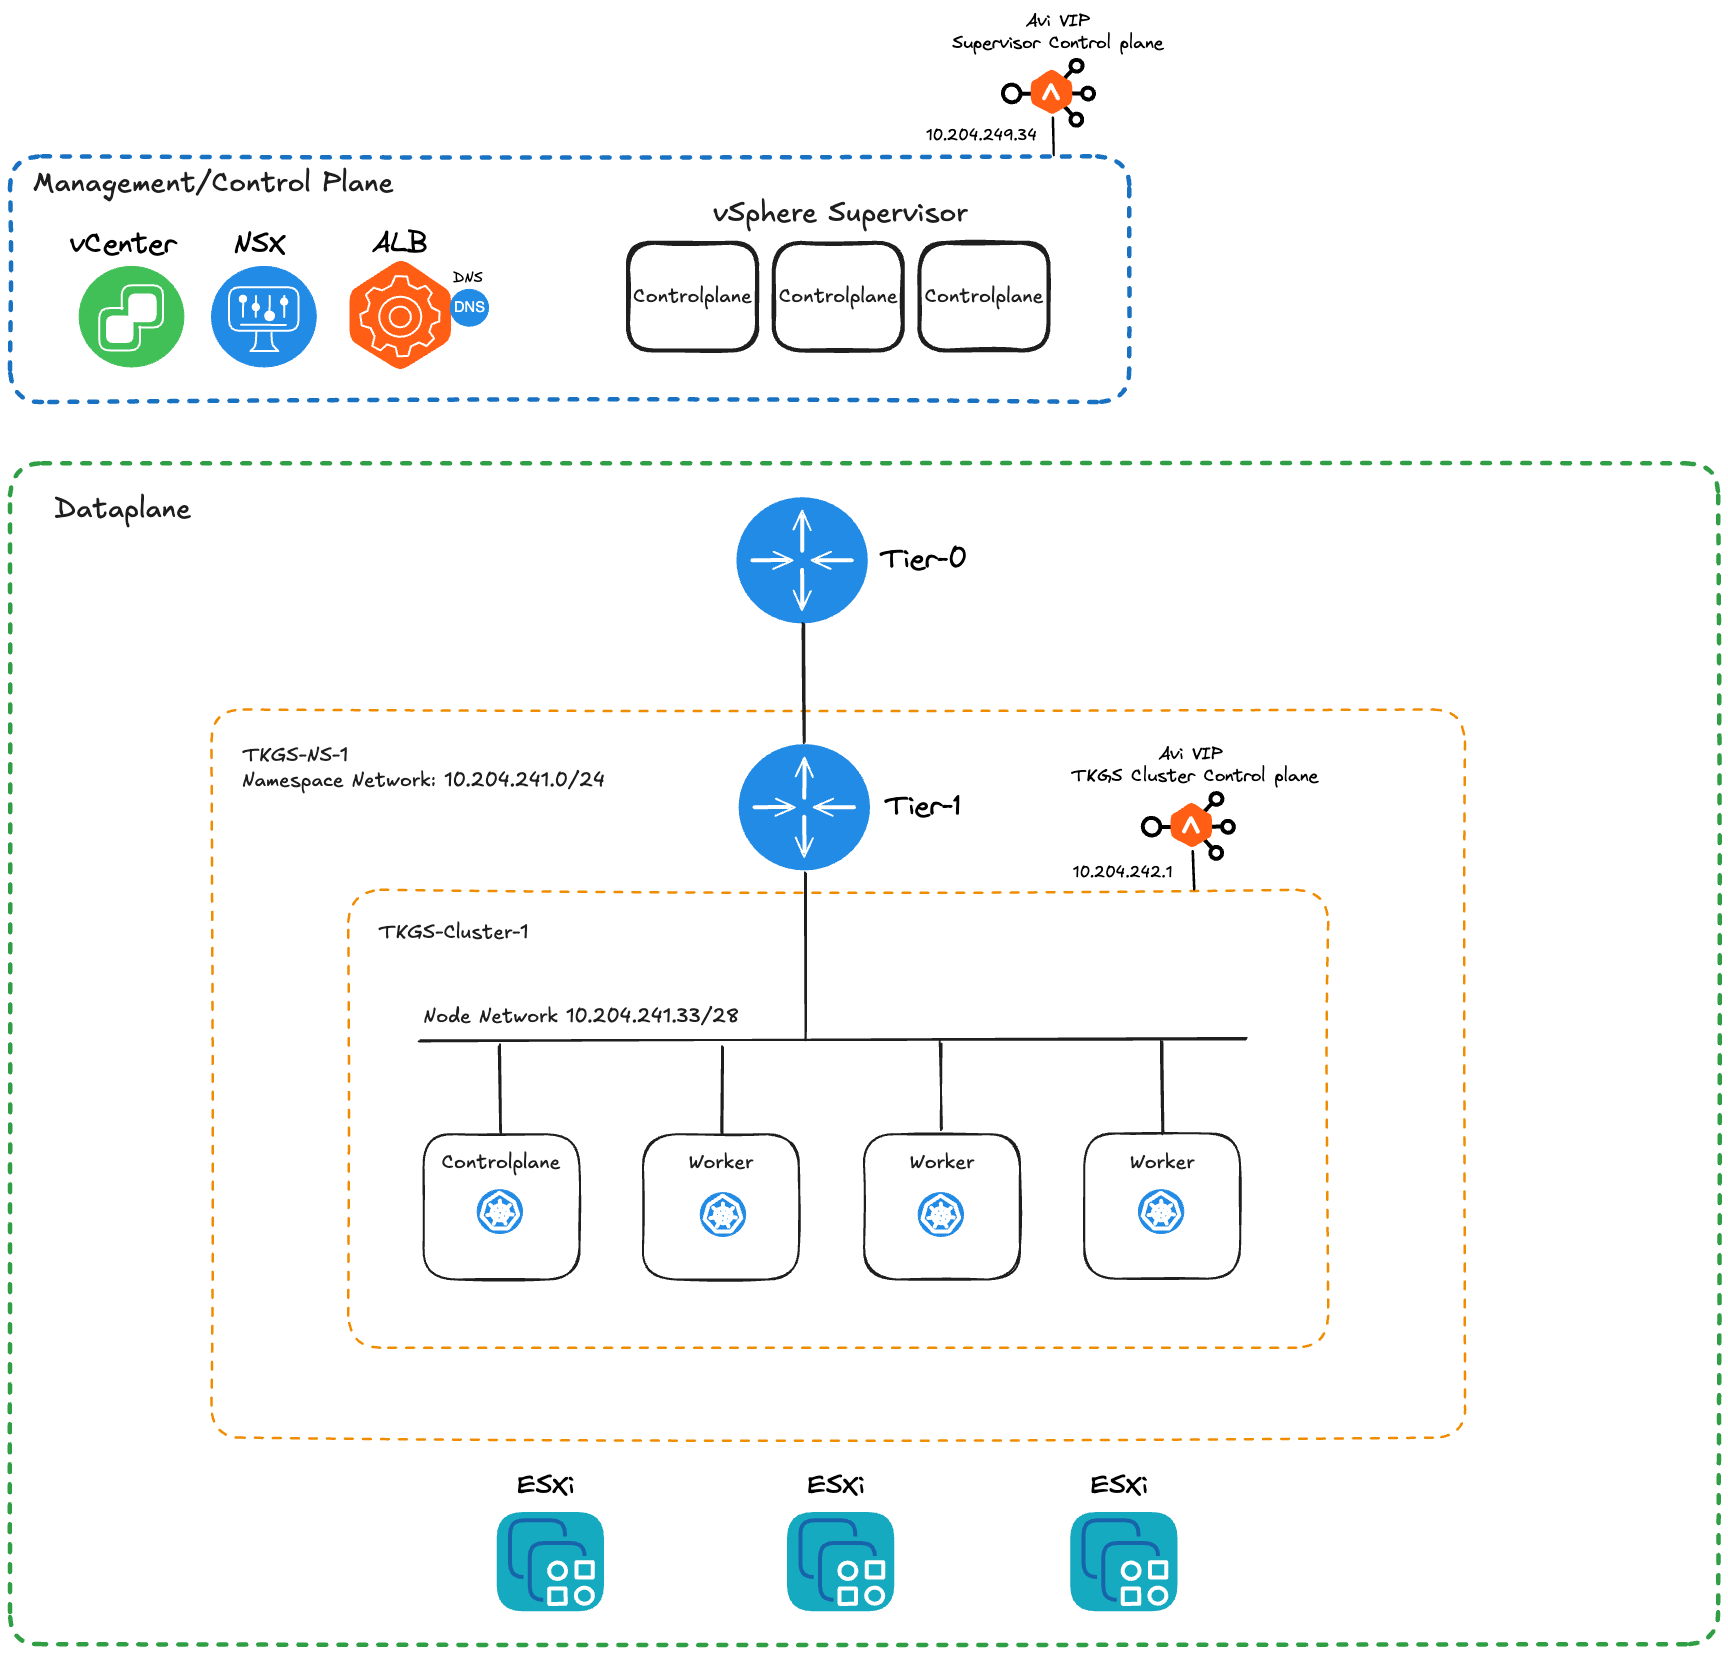
Obviously, not all details are provided in this overview, but it should at least give you an idea on how the lab environment has been configured.
Step 1 – Enable FlowExporter in AntreaConfig
The first step is to make sure that the Antrea FlowExporter feature is enabled in our cluster.
Connect to the Supervisor endpoint for our Namespace:
kubectl vsphere login --server=10.204.249.34 --vsphere-username administrator@vsphere.local --insecure-skip-tls-verify
Switch to the context where the AntreaConfig is stored:
kubectl config use-context tkgs-ns-1
Fetch the name of the AntreaConfig:
kubectl get AntreaConfig -o=custom-columns=NAME:.metadata.name

tkgs-cluster-1-antrea-package
And finally edit the AntreaConfig:
kubectl edit AntreaConfig tkgs-cluster-1-antrea-package
Here we need have a look at two items:
spec.antrea.config.featureGates.FlowExporterspec.antrea.config.flowExporter.enable
Both of these flags must be set to true:
apiVersion: cni.tanzu.vmware.com/v1alpha1
kind: AntreaConfig
metadata:
  name: tkgs-cluster-1-antrea-package
  namespace: tkgs-ns-1
spec:
  antrea:
    config:
      featureGates:
        ...
        FlowExporter: true
      flowExporter:
        ...
        enable: true
In the case that changes had to be made to the AntreaConfig, the Antrea agents need to be restarted inside the TKG Service cluster. Connect to the TKG Service cluster:
kubectl vsphere login --server=10.204.249.34 --tanzu-kubernetes-cluster-name tkgs-cluster-1 --tanzu-kubernetes-cluster-namespace tkgs-ns-1 --vsphere-username administrator@vsphere.local --insecure-skip-tls-verify
Switch to the context of the cluster:
kubectl config use-context tkgs-cluster-1
Issue the following command to restart the Antrea agent pods:
kubectl delete pod -n kube-system -l app=antrea
Step 2 – Install the Flow Aggregator
Next we install the Flow Aggregator and for that we’ll use Helm. Make sure that you’re still connected to the TKG Service cluster and in the cluster’s context.
Add the Helm repository and receive the latest information about its charts:
helm repo add antrea https://charts.antrea.io
helm repo update
Install the Flow Aggregator using the following Helm command:
helm install flow-aggregator antrea/flow-aggregator --set clickHouse.enable=true,recordContents.podLabels=true -n flow-aggregator --create-namespace
Note: After installing the Flow Aggregator you wil notice that its pod moves into a CrashLoopBackOff state. This is expected behaviour as the service it’s trying to connect to is not installed yet.
Step 3 – Install and Configure Theia
Theia is installed on top of Antrea and consumes the network flows that are exported by Antrea.
What I like about Theia is that it comes with ClickHouse and Grafana pre-configured. This means that almost everything works out-of-the-box. Flow data is processed, stored, and visualized without having to spend time on manually configuring and maintaining integrations.
We’ll use Helm to install Theia as well:
helm install theia antrea/theia --set sparkOperator.enable=true,theiaManager.enable=true -n flow-visibility --create-namespace
I mentioned that “almost” everything works out of the box. Well, life is rarely perfect, and to get everything working as intended, we (unfortunately) need to roll up our sleeves and get our hands dirty.
Fortunately, it’s not too complicated. What happened is that for some reason, a couple of columns are missing for some tables in the ClickHouse database. We need to manually add these to allow the Flow Aggregator pod to exit the CrashLoopBackOff state.
Exec into the Clickhouse pod and start a shell:
kubectl -n flow-visibility exec --stdin --tty chi-clickhouse-clickhouse-0-0-0 -- /bin/bash
Start the Clickhouse client:
clickhouse-client
Add the missing columns to the tables by using these commands:
ALTER TABLE default.flows ADD COLUMN appProtocolName String;
ALTER TABLE default.flows_local ADD COLUMN appProtocolName String;
ALTER TABLE default.flows ADD COLUMN httpVals String;
ALTER TABLE default.flows_local ADD COLUMN httpVals String;
ALTER TABLE default.flows ADD COLUMN egressNodeName String;
ALTER TABLE default.flows_local ADD COLUMN egressNodeName String;
Exit from the Clickhouse client and the pod.
BTW, I did appreciate the message that was printed when exiting the Clickhouse client. All is forgiven now, well, almost all 🙂

Step 4 – Consume Network Visibility
The components are in place and it’s time to have a look at what we’ve ended up with.
By default the Grafana Pod is exposed using a NodePort service:

This means that we can access Grafana on the IP address of a node using (in this case) port 32366. To help you find out which node IP and port you should use, the Theia documentation provides a series of commands that will provide that information:
NODE_NAME=$(kubectl get pod -l app=grafana -n flow-visibility -o jsonpath='{.items[0].spec.nodeName}')
NODE_IP=$(kubectl get nodes ${NODE_NAME} -o jsonpath='{.status.addresses[0].address}')
GRAFANA_NODEPORT=$(kubectl get svc grafana -n flow-visibility -o jsonpath='{.spec.ports[*].nodePort}')
echo "=== Grafana Service is listening on ${NODE_IP}:${GRAFANA_NODEPORT} ==="
=== Grafana Service is listening on 10.204.241.38:32366 ===
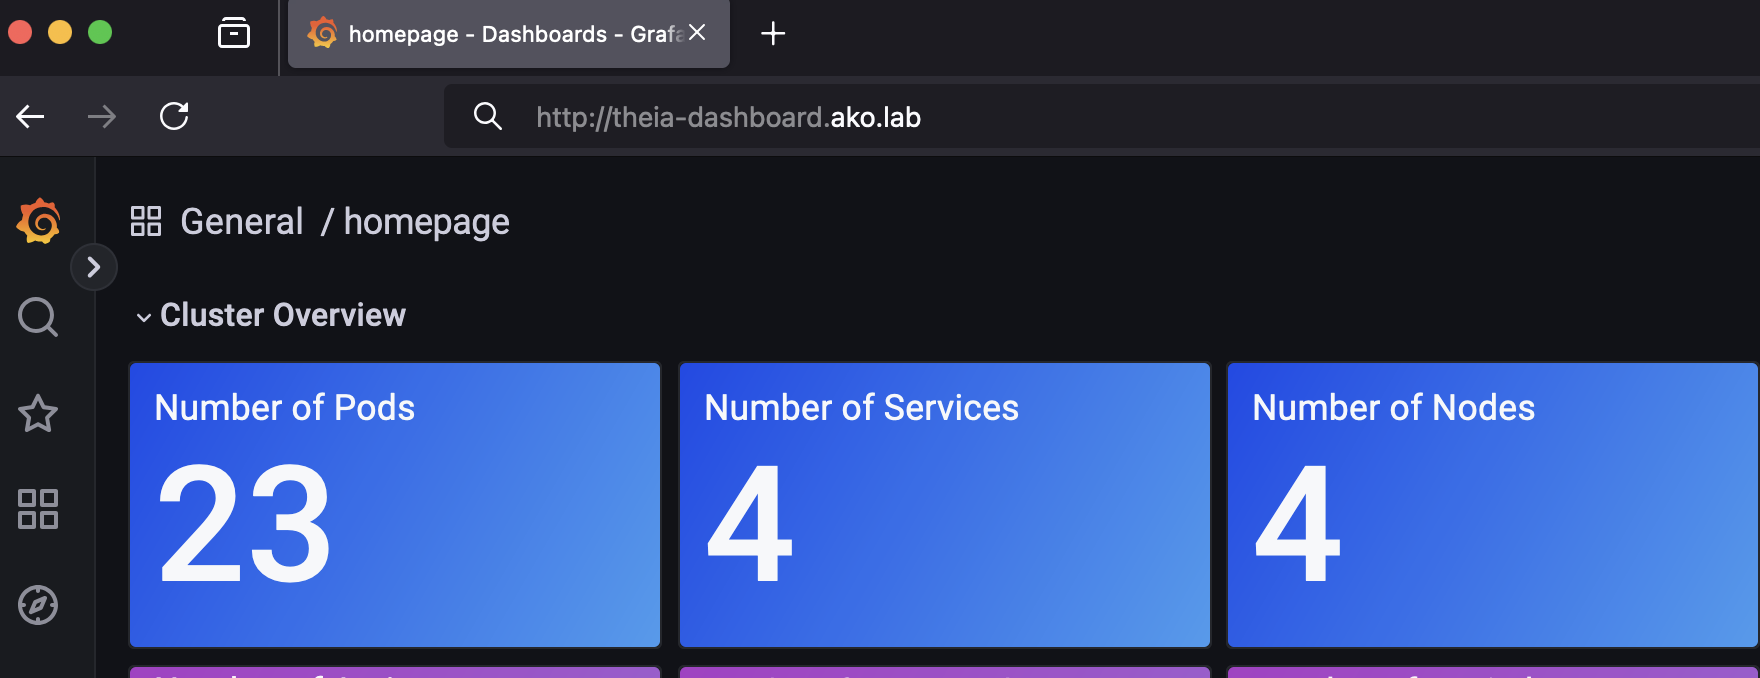
Using that IP address and port, we can connect to the Grafana service. After logging in with the default credentials (username: admin, password: admin) and changing the initial password, we arrive at the homepage. This page provides an cluster overview dashboard featuring some key metrics for the entire cluster:

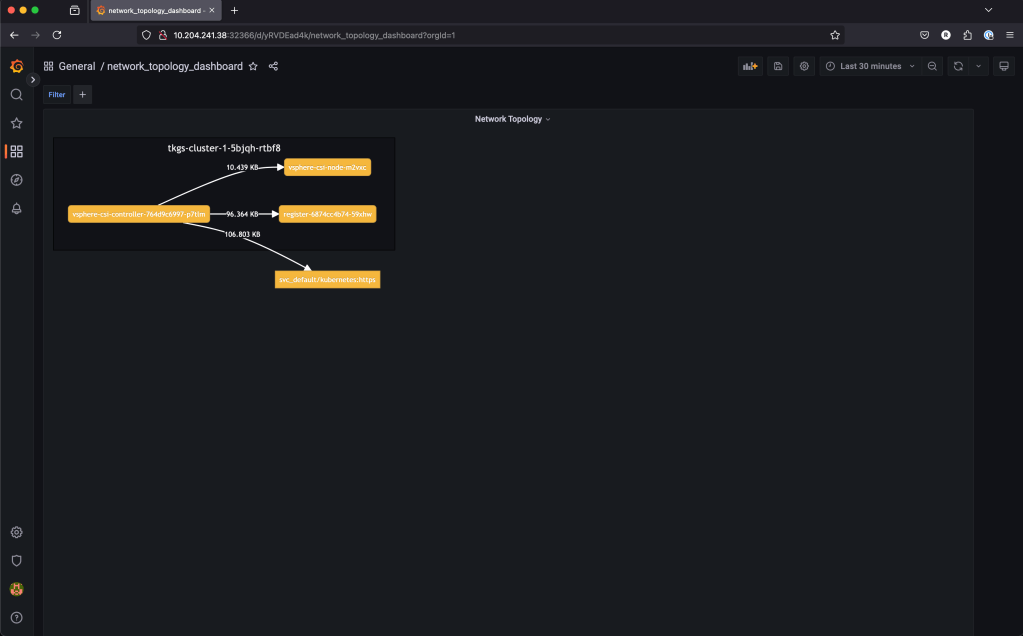
There are eight dashboard pages in total. The Flow Records and the Network Topology dashboards look particulary interesting as well:

Bonus Step – Ingress for Grafana
As mentioned earlier, I deployed and configured Avi Load Balancer with a DNS virtual service for this lab. Additionally, I set up the Avi Kubernetes Operator in my TKG Service cluster (tkgs-cluster-1). With these components in place, I can create an Ingress to access the Grafana service using a proper FQDN:
First I expose the Grafana pod as a ClusterIP service. My theia-dashboard-service.yaml contains the following:
---
apiVersion: v1
kind: Service
metadata:
  name: theia-dashboard-service
  namespace: flow-visibility
spec:
  selector:
    app: grafana
  ports:
    - port: 3000
Creating the service:
kubectl apply -f theia-dashboard-service.yaml
Next, I create the Ingress. My theia-dashboard-ingress.yaml looks like this:
apiVersion: networking.k8s.io/v1
kind: Ingress
metadata:
  name: theia-dashboard-ingress
  namespace: flow-visibility
spec:
  ingressClassName: avi-lb
  rules:
    - host: theia-dashboard.ako.lab
      http:
        paths:
        - path: /
          pathType: Prefix
          backend:
            service:
              name: theia-dashboard-service
              port:
                number: 3000
Creating the Ingress:
kubectl apply -f theia-dashboard-ingress.yaml
Now AKO will do its magic creating a pool, VIP, and a virtual service. Additionally, Avi Load Balancer DNS will take care of registring the DNS record (theia-dashboard.ako.lab):
k get ingress -n flow-visibility
NAME                      CLASS    HOSTS                     ADDRESS        PORTS   AGE
theia-dashboard-ingress   avi-lb   theia-dashboard.ako.lab   10.204.244.5   80      4h51m
Using the FQDN as defined in my Ingress to reach Grafana:
Summary
Adding network visibility to your TKG Service clusters—or any Kubernetes cluster using the Antrea CNI, for that matter—is not a complex task. Aside from the missing columns issue, it actually works seamlessly out of the box. These are exactly the kinds of solutions many of my customers are looking for. 😊
Hopefully this article gave you some inspiration on your network observability journey.
Thank you for reading! Feel free to share your thoughts or ask questions in the comments below or reach out to me directly.

Leave a comment