During some research I did for a customer on how to trigger an action based on an error event in the SDDC, I built myself a lab and ended up with a concept that seems interesting enough to write some lines about on the blog.
High-Level
The diagram below illustrates the “solution” at a high-level:

No rocket science here. A system logs an event to Log Insight which generates an alert that triggers a Jenkins pipeline which remediates the system.
So what does setting this up look like? Must be pretty difficult? I thought so too, but let’s have a look at an example in this article.
Remediate The NSX-T Distributed Firewall
In this simple example the “system” is the NSX-T Distributed Firewall (DFW) Default Layer 3 Rule. This is the last rule in the DFW table which determines what to do with traffic that is not matching any other rules (Drop or Allow).
In our example we want traffic not being picked up by other DFW rules to be dropped and therefore the Default Layer 3 Rule is configured with a “Drop” action.

If for some reason the action is changed to “Allow”, we want it to automatically revert back to “Drop” as that is our desired/required state.
So there we have the use case for some event-driven automation.
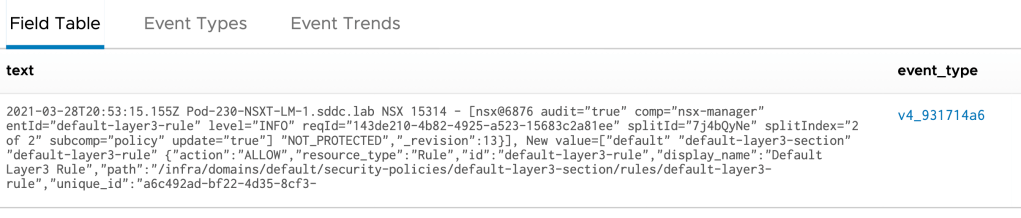
Step 1 – Identify The Event And Construct A Log Insight Query
Before we can do anything meaningful we need to find the event that is logged when we change the firewall rule action to “Allow”. In this case the event in Log Insight looks like this:
I’m fairly confident that the following Log Insight query is reliable enough for our example use case:
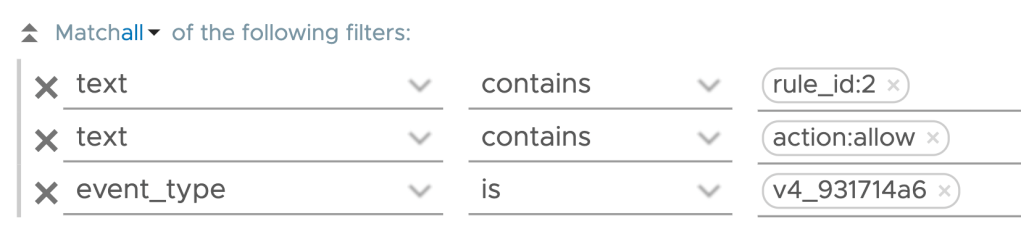
text contains rule_id:2
text contains action:allow
event_type is v4_931714a6
Step 2 – Create Alert From Query
If the query comes back with a match, i.e, the DFW rule’s action has been changed to “Allow”, an alert should be activated. This alert is configured directly from the Log Insight Interactive Analytics interface where we also constructed our query.
The alert I’m creating looks likes this:
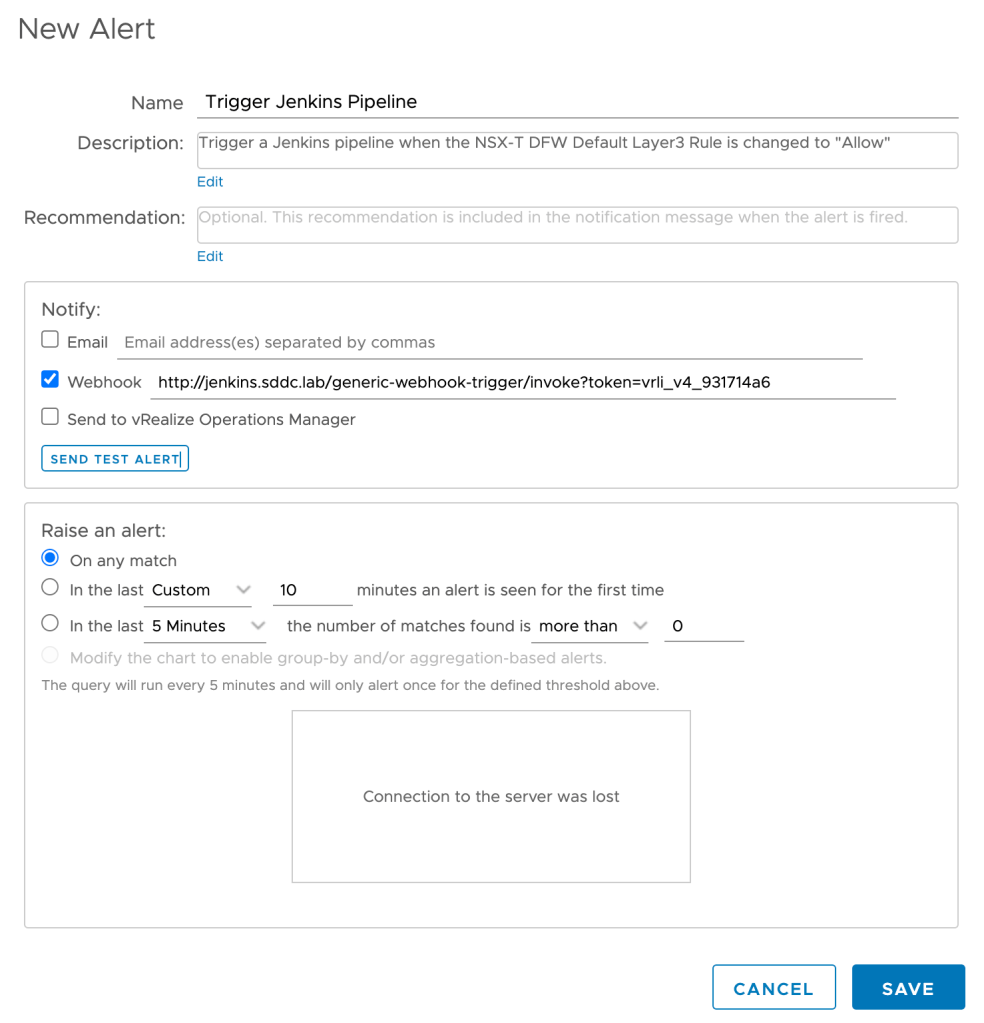
As you can see I’m using a webhook to notify a Jenkins pipeline. We will look more at Jenkins in the coming steps. For now it’s good to understand that Log Insight will execute a HTTP POST request each time the defined query comes back with a match.
Step 3 – Configure Jenkins Pipeline Build Trigger
I decided to use the Generic Webhook Trigger plugin on Jenkins which extends the build triggers of a pipeline to allow easy triggering through HTTP requests (e.g. webhooks).
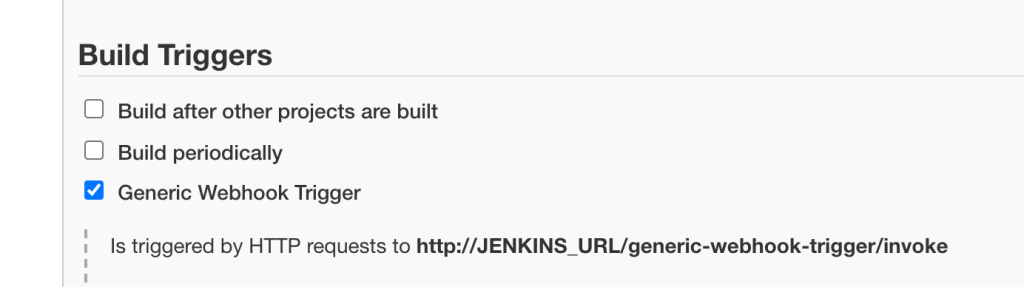
In our simple example very little configuration is required for the Generic Webhook Trigger configuration. Besides enabling it I’m adding a token to distinguish this build trigger from any others I might be creating:
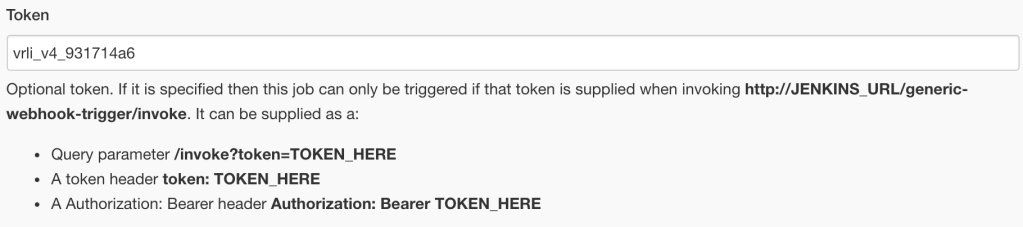
This trigger URL (http://jenkins.sddc.lab:8080/generic-webhook-trigger/invoke?token=vrli_v4_931714a6) is used as the webhook URL when configuring the alert in Log Insight.
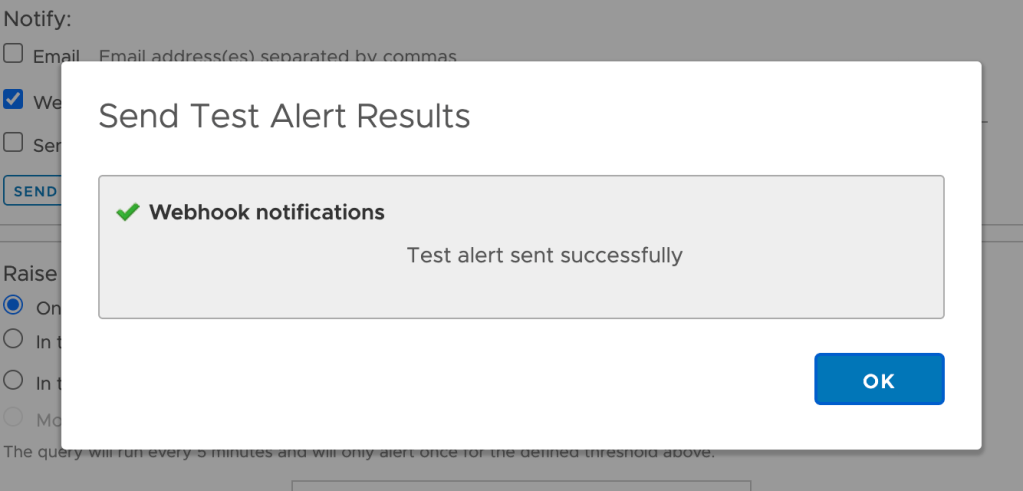
Back in Log Insight we can actually send a test alert to the webhook. This should result in the following message which indicates that Jenkins and specifically the webhook trigger are working:
Step 4 – Configure Jenkins Pipeline Script
The pipeline script contains the code that is executed to remediate our NSX-T DFW undesired state. NSX-T of course has a REST API which makes things relatively easy to configure.
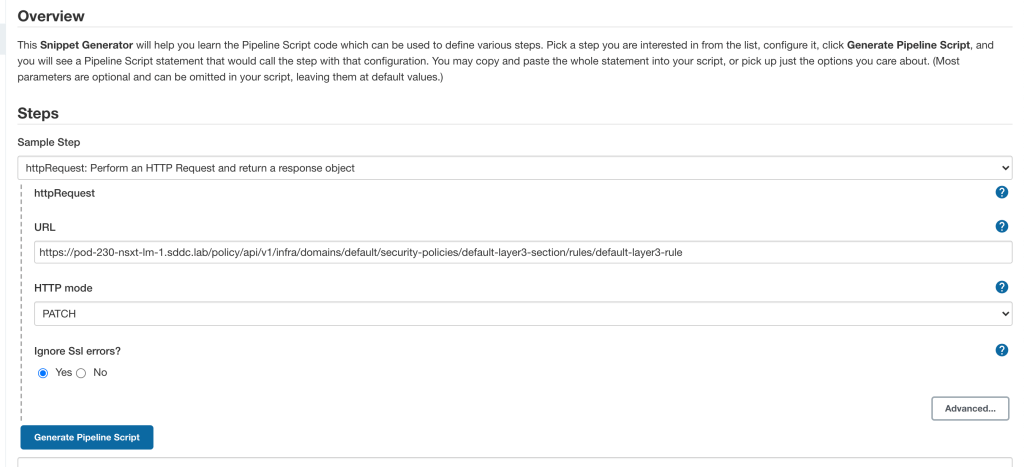
Using the Jenkins Pipeline Syntax and Snippet Generator for a httpRequest step, it was easy to put together a pipeline script that performs the HTTP PATCH request to the NSX-T API:
For reference the complete pipeline script including the JSON payload that’s send to the NSX-T API looks as follows:
pipeline {
    agent any

    stages {
        stage('Hello') {
            steps {
                httpRequest authentication: 'nsx-t', consoleLogResponseBody: true, contentType: 'APPLICATION_JSON', httpMode: 'PATCH', ignoreSslErrors: true, requestBody: '''{
                    "action": "DROP",
                    "resource_type": "Rule",
                    "id": "default-layer3-rule",
                    "display_name": "Default Layer3 Rule",
                    "path": "/infra/domains/default/security-policies/default-layer3-section/rules/default-layer3-rule",
                    "relative_path": "default-layer3-rule",
                    "parent_path": "/infra/domains/default/security-policies/default-layer3-section",
                    "unique_id": "a6c492ad-bf22-4d35-8cf3-ec09f6beeb66",
                    "marked_for_delete": false,
                    "overridden": false,
                    "rule_id": 2,
                    "sequence_number": 2147483647,
                    "sources_excluded": false,
                    "destinations_excluded": false,
                    "source_groups": [
                        "ANY"
                    ],
                    "destination_groups": [
                        "ANY"
                    ],
                    "services": [
                        "ANY"
                    ],
                    "profiles": [
                        "ANY"
                    ],
                    "logged": false,
                    "scope": [
                        "ANY"
                    ],
                    "disabled": false,
                    "direction": "IN_OUT",
                    "ip_protocol": "IPV4_IPV6",
                    "is_default": true,
                    "_create_user": "system",
                    "_create_time": 1616953731606,
                    "_last_modified_user": "admin",
                    "_last_modified_time": 1616961662317,
                    "_system_owned": false,
                    "_protection": "NOT_PROTECTED",
                    "_revision": 9
                }''', responseHandle: 'NONE', url: 'https: //pod-230-nsxt-lm-1.sddc.lab/policy/api/v1/infra/domains/default/security-policies/default-layer3-section/rules/default-layer3-rule', wrapAsMultipart: false
            }
        }
    }
}
This piece of code will change the default DFW rule action to “Drop”.
Step 5 – Test
Now that the alert definition, trigger, and remediation script are in place the waiting begins. When will somebody accidentally change the DFW rule’s action to “Allow”? Maybe soon?

In Log Insight we can see that our event of interest was detected several times and alerts were sent to the Jenkins webhook:

In the Jenkins UI we can see that the pipeline was built several times:
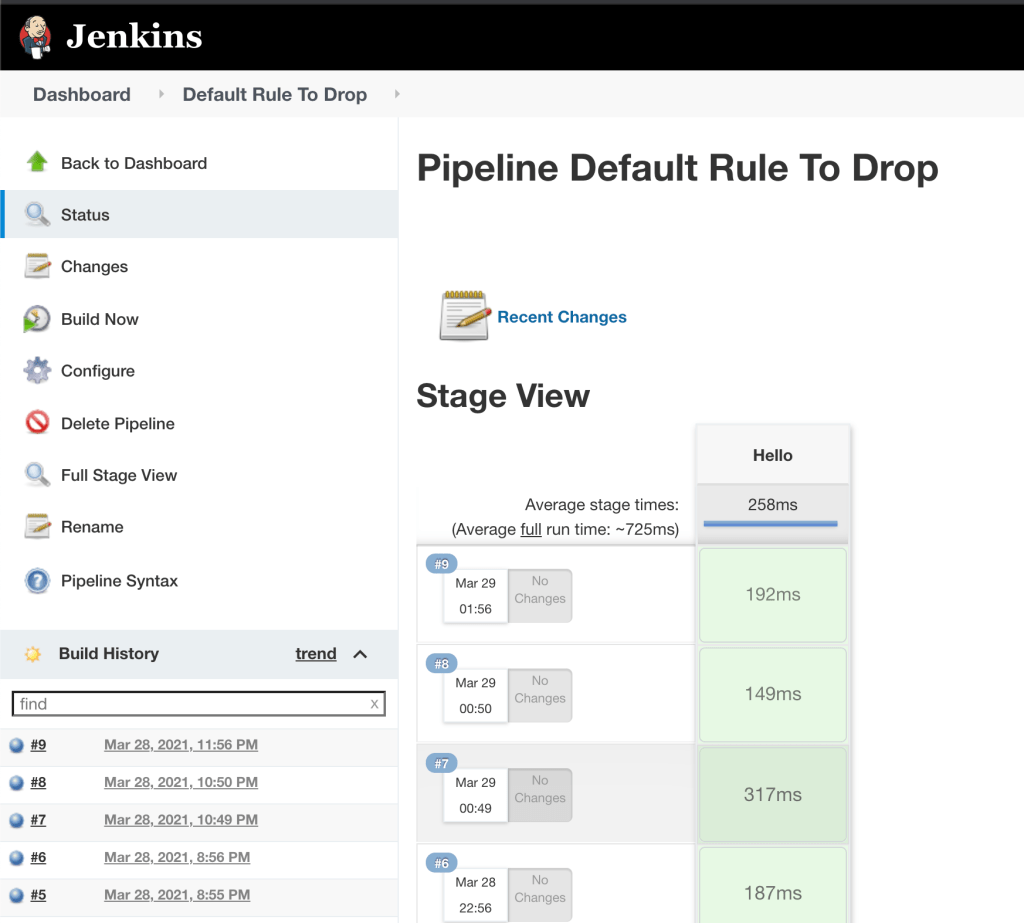
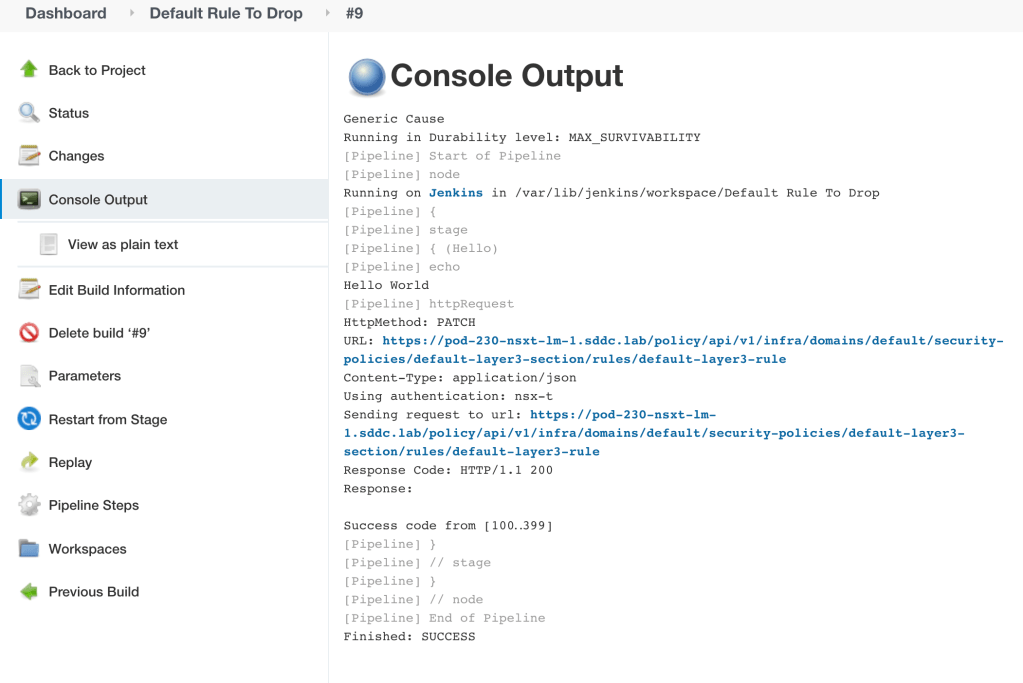
Let’s have a closer look at build #9. The Console Output is pretty useful to have a look at:
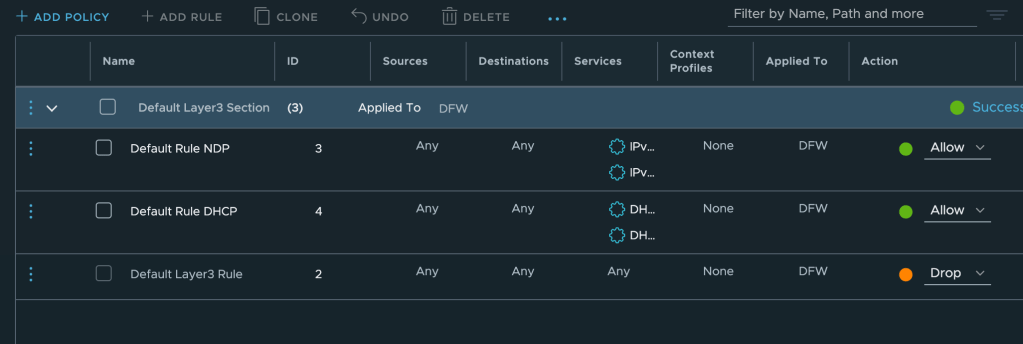
Now let’s have a look at the DFW to see what happened with that firewall rule:
Summary
Not that difficult, right? We went through setting up a simple event-driven workflow using a Log Insight – Jenkins webhook integration. This example can easily be expanded upon. Both on the Log Insight and the Jenkins side we can of course do much more sophisticated stuff where the only limit is our imagination.
In today’s example the use case was to remediate. It might just as well be to create something. For example when a new tenant’s virtual machine folders are created in vCenter, Jenkins executes an Ansible or terraform script that builds the entire NSX-T logical network infrastructure for that tenant.
One last thing worth mentioning is that the JSON payload send by Log Insight to Jenkins, contains all the event data. This data can be interpreted and used (as variables) in the pipeline script so that we can run very granular/targeted actions.
Thanks for reading.

Leave a comment